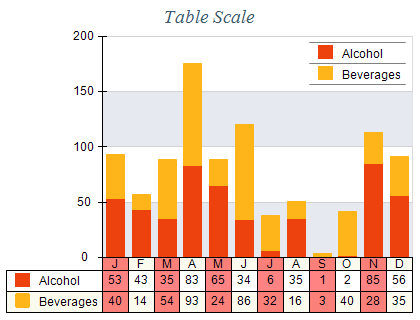
In many cases it is useful to display a table instead of a standard categorical / hierachical axis. In such cases you can use the NTableScaleConfigurator class. The following picture shows a chart with a table scale applied on its x axis:
You create a table scale by creating an instance of the NTableScaleConfigurator class:
| C# |
Copy Code
|
|
NTableScaleConfigurator tableScale = new NTableScaleConfigurator();
chart.Axis(StandardAxis.PrimaryX).ScaleConfigurator = tableScale;
|
| Visual Basic |
Copy Code
|
|
Dim tableScale As New NTableScaleConfigurator
chart.Axis(StandardAxis.PrimaryX).ScaleConfigurator = tableScale
|
After you create the table scale you can add different types of rows to it:
Adding Custom Data Rows
As the name suggests custom data rows contain data that is specified by the user. In the above picture the months in the table ("J", "F", "M" etc.) are specified using this type of scale table row. The following code snippet shows how to add a custom data row to the table scale:
| C# |
Copy Code
|
|
NCustomTableScaleRow customRow = new NCustomTableScaleRow();
customRow.Items = new object[] { "J", "F", "M", "A", "M", "J", "J", "A", "S", "O", "N", "D" };
tableScale.Rows.Add(customRow);
|
| Visual Basic |
Copy Code
|
|
Dim customRow As New NCustomTableScaleRow
customRow.Items = New Object() {"J", "F", "M", "A", "M", "J", "J", "A", "S", "O", "N", "D"}
tableScale.Rows.Add(customRow)
|
Adding Series Data Rows
The other type of row you can add to a table scale is the NSeriesTableScaleRow, which inserts the formatted contents of a user specified series to the scale table. The following code snippet shows how to add a row of this type:
| C# |
Copy Code
|
|
NSeriesTableScaleRow seriesRow = new NSeriesTableScaleRow();
seriesRow.Series = someSeries;
tableScale.Rows.Add(seriesRow);
|
| Visual Basic |
Copy Code
|
|
Dim seriesRow As New NSeriesTableScaleRow()
seriesRow.Series = someSeries
tableScale.Rows.Add(seriesRow)
|
The information that's presented in each row cell is controlled from the series legend format property - for example:
| C# |
Copy Code
|
|
series.Legend.Format = "<percent>";
|
| Visual Basic |
Copy Code
|
|
series.Legend.Format = "<percent>"
|
The format string are the same you can use in legend label formatting. This type of table row also supports left / right headers:
| C# |
Copy Code
|
|
seriesRow.ShowLeftRowHeader = true;
seriesRow.ShowRightRowHeader = true;
|
| Visual Basic |
Copy Code
|
|
seriesRow.ShowLeftRowHeader = True
seriesRow.ShowRightRowHeader = True
|
The left / right headers function in the same way as series legend items.
Label Styles
Both the custom and series scale rows expose three properties that allow you to modify the apperanace of row cell labels. These properties are called LabelStyle, LeftHeaderLabelStyle and RightHeaderLabelStyle. The following code snippet shows how to change the font size of row labels:
| C# |
Copy Code
|
|
tableScaleRow.LabelStyle.TextStyle.FontStyle.EmSize = new NLength(13, NGraphicsUnit.Point);
|
| Visual Basic |
Copy Code
|
|
tableScaleRow.LabelStyle.TextStyle.FontStyle.EmSize = New NLength(13, NGraphicsUnit.Point)
|
The HorizontalBorderStyle and VerticalBorderStyle properties of the NTableScaleConfigurator allow to specify the horizontal / vertical table grid lines. The following code snippet changes the table gridlines to red:
| C# |
Copy Code
|
|
tableScale.HorizontalBorderStyle = new NStrokeStyle(1, Color.Red);
tableScale.VerticalBorderStyle = new NStrokeStyle(1, Color.Red);
|
| Visual Basic |
Copy Code
|
|
tableScale.HorizontalBorderStyle = New NStrokeStyle(1, Color.Red)
tableScale.VerticalBorderStyle = New NStrokeStyle(1, Color.Red)
|
Table interlacing allows you to highlight table rows or columns so that the table becomes more legible. The following code shows how to show row interlace stipes:
| C# |
Copy Code
|
|
NTableInterlaceStyle rowInterlaceStyle = new NTableInterlaceStyle();
rowInterlaceStyle.Type = TableInterlaceStyleType.Row;
rowInterlaceStyle.Length = 1;
rowInterlaceStyle.Interval = 1;
rowInterlaceStyle.FillStyle = new NColorFillStyle(Color.FromArgb(124, Color.Beige));
tableScale.InterlaceStyles.Add(rowInterlaceStyle);
NTableInterlaceStyle colInterlaceStyle = new NTableInterlaceStyle();
colInterlaceStyle.Type = TableInterlaceStyleType.Col;
colInterlaceStyle.Length = 1;
colInterlaceStyle.Interval = 1;
colInterlaceStyle.FillStyle = new NColorFillStyle(Color.FromArgb(124, Color.Red));
tableScale.InterlaceStyles.Add(colInterlaceStyle);
|
| Visual Basic |
Copy Code
|
|
Dim rowInterlaceStyle As New NTableInterlaceStyle()
rowInterlaceStyle.Type = TableInterlaceStyleType.Row
rowInterlaceStyle.Length = 1
rowInterlaceStyle.Interval = 1
rowInterlaceStyle.FillStyle = New NColorFillStyle(Color.FromArgb(124, Color.Beige))
tableScale.InterlaceStyles.Add(rowInterlaceStyle)
Dim colInterlaceStyle As New NTableInterlaceStyle()
colInterlaceStyle.Type = TableInterlaceStyleType.Col
colInterlaceStyle.Length = 1
colInterlaceStyle.Interval = 1
colInterlaceStyle.FillStyle = New NColorFillStyle(Color.FromArgb(124, Color.Red))
tableScale.InterlaceStyles.Add(colInterlaceStyle)
|