In This Topic
Timeline configurators allow you to configure a scale to display date/time information by decorating the scale using several date/time units. By doing this the scale becomes more informative to the end user as it allows him/her to view important date/time events that happen inside the date/time range displayed by the scale.
To illustrate why this is important lets examine a simple scale showing the date/time range from [November, 11, 2008] to [January ,11, 2009]. One way to denote this range on a chart is by using a standard date/time scale configurator with date formatting:
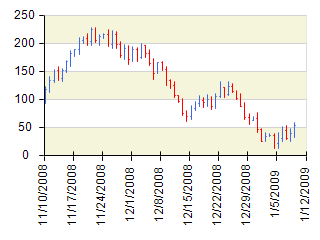
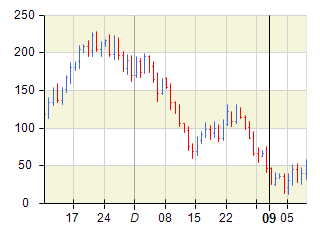
Although this date/time annotation of the scale is correct it is not very informative, because it will not highlight important date/time events on the scale such as month and year change. In addition it is not very practical to display month and year information for each date as they do not change often -in the above example eight labels have the same year (2008) and five labels have the same month (December). To solve this you may decide to use a timeline scale configurator, which allows you to decorate the scale using several date time units for sampling. The following pictures show how the same date/time range will be decorated using a value timeline scale and range timeline scale:
| Value timeline scale (using the NValueTimelineScaleConfigurator class) |
Range timeline scale (using by the NRangeTimelineScaleConfigurator class) |
 |
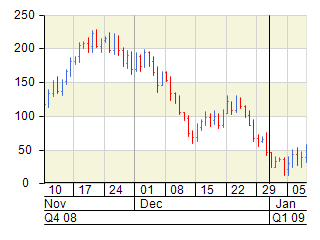 |
Note that this time the scale is decorated by preserving the important date/time events. On both scales the date time range is sampled by using week, month and quarter year date/time units with step one. Although the annotations are almost the same you may have noticed that the week start of December 29 is not denoted with a label on the first one. This is because the scale has determined that it will overlap visually with the year start of 2009, which is considered more important since it denotes a year start vs a week start.
In general value timeline scales are used when the chart has to be more compact. They also use date/time formatting producing more compact labels. Range timeline scales on the other hand allow you to display more complete date time information, without loss of overlapping labels, but consume more visual space.
As visible from the range timeline scale picture above, timeline scales by default consist of three scale levels sampled with a date time unit (automatically selected by default) with step one. The value timeline scale also uses this approach, but instead of creating a new scale level it combines the levels in one visual level. Each level in a timeline scale is represented by an instance of the NValueTimelineScaleRow or NRangeTimelineScaleRow classes depending on the type of timeline scale. The following sections show to how to perform the most common customization tasks with timeline scales.
Creating a Timeline Scale Configurator
The following code snippets show how to apply a value timeline scale configurator to the PrimaryX axis:
| C# |
Copy Code
|
|
NChart chart = nChartControl1.Charts[0];
NAxis axis = chart.Axis(StandardAxis.PrimaryX);
NValueTimelineScaleConfigurator timeLineScale = new NValueTimelineScaleConfigurator();
timeLineScale.MajorGridStyle.SetShowAtWall(ChartWallType.Back, true);
timeLineScale.SecondRow.GridStyle.SetShowAtWall(ChartWallType.Back, true);
timeLineScale.ThirdRow.GridStyle.SetShowAtWall(ChartWallType.Back, true);
axis.ScaleConfigurator = timeLineScale;
|
| Visual Basic |
Copy Code
|
|
Dim chart As NCartesianChart = NChartControl1.Charts(0)
Dim axis As NAxis = chart.Axis(StandardAxis.PrimaryX)
Dim timeLineScale As New NValueTimelineScaleConfigurator
timeLineScale.MajorGridStyle.SetShowAtWall(ChartWallType.Back, True)
timeLineScale.SecondRow.GridStyle.SetShowAtWall(ChartWallType.Back, True)
timeLineScale.ThirdRow.GridStyle.SetShowAtWall(ChartWallType.Back, True)
axis.ScaleConfigurator = timeLineScale
|
Note that the above code will also enable the gridlines for the first, second and third rows of the scale. For readability reasons they have different color, which helps the end user to visually distinguish the more important date/time events on the scale.
Controlling the Allowed Date Time Units
By default timeline scales can choose from the following date/time units: Century, Decade, Year, HalfYear, Quarter, Month, Week, Day, HalfDay, Hour, Minute, Second and Millisecond. In some cases you may want to disable certain date/time units - for example you may wish to restrict the scale not to use quarter year or half year when decorating. This is done by modifying the AutoDateTimeUnits array:
| C# |
Copy Code
|
|
NChart chart = nChartControl1.Charts[0];
NAxis axis = chart.Axis(StandardAxis.PrimaryX);
NValueTimelineScaleConfigurator timeLineScale = new NValueTimelineScaleConfigurator();
timeLineScale.AutoDateTimeUnits = new NDateTimeUnit[] { NDateTimeUnit.Century,
NDateTimeUnit.Decade,
NDateTimeUnit.Year,
NDateTimeUnit.Month,
NDateTimeUnit.Week,
NDateTimeUnit.Day,
NDateTimeUnit.HalfDay,
NDateTimeUnit.Hour,
NDateTimeUnit.Minute,
NDateTimeUnit.Second,
NDateTimeUnit.Millisecond };
axis.ScaleConfigurator = timeLineScale;
|
| Visual Basic |
Copy Code
|
|
Dim chart As NCartesianChart = NChartControl1.Charts(0)
Dim axis As NAxis = chart.Axis(StandardAxis.PrimaryX)
Dim timeLineScale As New NValueTimelineScaleConfigurator
timeLineScale.AutoDateTimeUnits = New NDateTimeUnit() {NDateTimeUnit.Century, NDateTimeUnit.Decade, NDateTimeUnit.Year, NDateTimeUnit.Month, NDateTimeUnit.Week, NDateTimeUnit.Day, NDateTimeUnit.HalfDay, NDateTimeUnit.Hour, NDateTimeUnit.Minute, NDateTimeUnit.Second, NDateTimeUnit.Millisecond}
axis.ScaleConfigurator = timeLineScale
|
Hiding Timeline Rows
When you want to hide a timeline row (level) you must set it's Visible property to false. The following code hides the third row of a range timeline scale configurator:
| C# |
Copy Code
|
|
NChart chart = nChartControl1.Charts[0];
NAxis axis = chart.Axis(StandardAxis.PrimaryX);
NRangeTimelineScaleConfigurator timeLineScale = new NRangeTimelineScaleConfigurator();
timeLineScale.ThirdRow.Visible = false;
axis.ScaleConfigurator = timeLineScale;
|
| Visual Basic |
Copy Code
|
|
Dim chart As NCartesianChart = NChartControl1.Charts(0)
Dim axis As NAxis = chart.Axis(StandardAxis.PrimaryX)
Dim timeLineScale As New NRangeTimelineScaleConfigurator
timeLineScale.ThirdRow.Visible = False
axis.ScaleConfigurator = timeLineScale
|
Changing Value Formatting
Timeline scales will format a date/time value depending on two factors - the date time unit selected for sampling the timeline row and the row number. This relatively complex way of formatting is required because the scale labels need to be compact and yet informative. For example it does not make much sense to format year quarters when they appear in the first row of a timeline scale with year information as the next two levels will be sampled using year or half year date/time unit, which will also display the year number. On the other hand if the quarter year unit is selected for the last row it makes sense to display the year as well, because there are no more rows on the scale. The following code snippets show to how to alter the value formatting of quarters when they are used to sample the third row on a a timeline scale:
| C# |
Copy Code
|
|
NChart chart = nChartControl1.Charts[0];
NAxis axis = chart.Axis(StandardAxis.PrimaryX);
NValueTimelineScaleConfigurator timeLineScale = new NValueTimelineScaleConfigurator();
timeLineScale.ThirdRow.DateTimeUnitFormatterPairs.QuarterFormatter = new NDateTimeValueFormatter("#Q yyyy");
axis.ScaleConfigurator = timeLineScale;
|
| Visual Basic |
Copy Code
|
|
Dim chart As NCartesianChart = NChartControl1.Charts(0)
Dim axis As NAxis = chart.Axis(StandardAxis.PrimaryX)
Dim timeLineScale As New NRangeTimelineScaleConfigurator
timeLineScale.ThirdRow.DateTimeUnitFormatterPairs.QuarterFormatter = New NDateTimeValueFormatter("#Q yyyy")
axis.ScaleConfigurator = timeLineScale
|
Defining a Working Calendar
Both the range and value timeline scales support the work calendar feature. For more information check out the the
Work Calendar topic.
Related Examples
Windows Forms: Axes \ Scaling \ Value Timeline Scale
Windows Forms: Axes \ Scaling \ Range Timeline Scale
Web Forms: Axes \ Scaling \ Value Timeline Scale
Web Forms: Axes \ Scaling \ Range Timeline Scale