Nevron .NET Vision
Chart for .NET / User's Guide / Chart Types / Area / Stacked Percent Area

In This Topic
    Stacked Percent Area
    In This Topic

    Stacked Percent Area charts represent the relative contribution of data series to the total for each category. The series are displayed as sequences of straight line segments and the area below each line is filled. Each area series is stacked on top of the previous one. The height of the uppermost line is always the full height of the chart. The Y scale range is always from 0 to 1. The following figure displays a Stacked Percent Area chart:


    Figure 1.

     Creating the area series

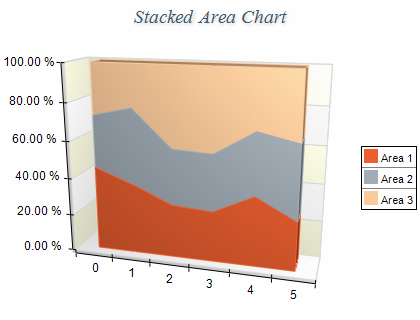
    Stacked Percent Area charts are displayed with several NAreaSeries objects. The MultiAreaMode property of the first area series must be set to MultiAreaMode.Series. The MultiAreaMode property of the subsequent area series must be set to MultiAreaMode.StackedPercent. The following example demonstrates how to create a Stacked Percent Area chart with three series:

    C#
    Copy Code
    // obtain a reference to the Cartesian chart that is created by default
    NCartesianChart chart = (NCartesianChart)chartControl.Charts[0];
    
    NAreaSeries area1 = (NAreaSeries)chart.Series.Add(SeriesType.Area);
    NAreaSeries area2 = (NAreaSeries)chart.Series.Add(SeriesType.Area);
    NAreaSeries area3 = (NAreaSeries)chart.Series.Add(SeriesType.Area);
    
    area1.MultiAreaMode = MultiAreaMode.Series;
    area2.MultiAreaMode = MultiAreaMode.StackedPercent;
    area3.MultiAreaMode = MultiAreaMode.StackedPercent;
    
    Visual Basic
    Copy Code
    ' obtain a reference to the Cartesian chart that is created by default
    Dim chart As NCartesianChart = chartControl.Charts(0)
    
    Dim area1 As NAreaSeries = chart.Series.Add(SeriesType.Area)
    Dim area2 As NAreaSeries = chart.Series.Add(SeriesType.Area)
    Dim area3 As NAreaSeries = chart.Series.Add(SeriesType.Area)
    
    area1.MultiAreaMode = MultiAreaMode.Series
    area2.MultiAreaMode = MultiAreaMode.StackedPercent
    area3.MultiAreaMode = MultiAreaMode.StackedPercent
    
     Stacked Percent Scaling

    When an area series is displayed in stacked percent mode the min value of the series is always 0 and the max value is always 1. In order to display the texts on the PrimaryY axis as percents you have to use the following code:

    C#
    Copy Code
    NStandardScaleConfigurator sc = (NStandardScaleConfigurator)chart.Axis(StandardAxis.PrimaryY).ScaleConfigurator;
    sc.LabelValueFormatter = new NNumericValueFormatter(NumericValueFormat.Percentage);
    
    Visual Basic
    Copy Code
    Dim sc As NStandardScaleConfigurator = chart.Axis(StandardAxis.PrimaryY).ScaleConfigurator
    sc.LabelValueFormatter = New NNumericValueFormatter(NumericValueFormat.Percentage)
    
     Stacks with negative values
    Stacked percent area charts do not support negative values, which means that all values are internally converted to their absolute value.
     Formatting Commands

    The following formatting commands inherited from the NSeries class have different meaning when an area series is stacked:

    <total> - displays the absolute sum of the values in the current stack.
    <cumulative> - displays the sum of the values up to the current stack value.
    <percent> - displays the percent contribution of the value to the total pile sum.

     Related Examples
    Windows forms: Chart Gallery\Area\Stacked Area
    See Also