In This Topic
An Error Chart can be used to indicate estimated error in a measurement. The error values are shown as "T" and upside-down "T" symbols above and below the primary value. The most common Error Chart displays errors only in Y values. XY Error Charts can display errors both in X and Y values. XYZ Error Charts are available in 3D mode if you need to display errors for X, Y and Z values simultaneously. The following figures display a 2D Error Bar Chart and a 3D XYZ Error Bar Chart.
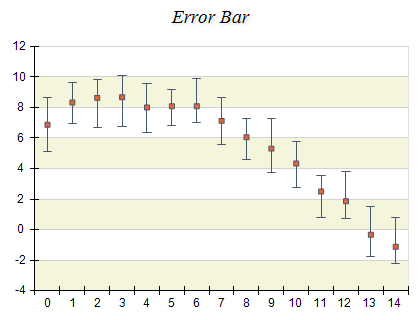
Figure 1.
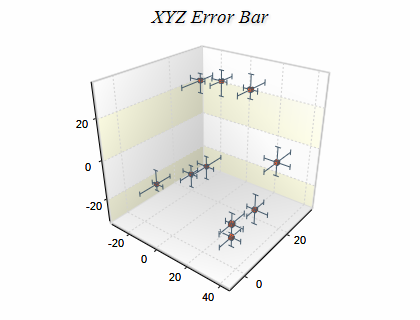
Figure 2.
Creating an error bar series
Error Bar series are represented by the NErrorBarSeries type. An instance of this type must be added to the series collection of a Cartesian chart.
| C# |
Copy Code
|
// obtain a reference to the Cartesian chart that is created by default
NCartesianChart chart = (NCartesianChart)chartControl.Charts[0];

// add an error bar series to it
NErrorBarSeries errorbar = (NErrorBarSeries)chart.Series.Add(SeriesType.ErrorBar);
|
| Visual Basic |
Copy Code
|
' obtain a reference to the Cartesian chart that is created by default
Dim chart As NCartesianChart = chartControl.Charts(0)

' add an error bar series to it
Dim errorbar As NErrorBarSeries = chart.Series.Add(SeriesType.ErrorBar)
|
Passing Data
Once the error bar series is created you can add some data in it. Error bar series use the following data series:
Values data series - contains the elevation values
XValues data series - contains x position values
ZValues data series - contains depth position values
LowerErrorsX data series - contains the lower X error values
UpperErrorsX data series - contains the upper X error values
LowerErrorsY data series - contains the lower Y error values
UpperErrorsY data series - contains the upper Y error values
LowerErrorsZ data series - contains the lower Z error values
UpperErrorsZ data series - contains the upper Z error values
You can either manipulate directly these data series, or use the data point interface to add data. The NErrorBarDataPoint class provides several constructors that can be very helpful when you add error bar data points. Please refer to the Working with Data Points topic for more information.
Controlling the visibility and size of the error bars
The Error Bar series is able to display errors for the X, Y and Z dimensions. The visibility of the errors can be controlled thorough the following properties:
ShowLowerErrorX and ShowUpperErrorX control the visibility of the X dimension errors.
ShowLowerErrorY and ShowUpperErrorY control the visibility of the Y dimension errors.
ShowLowerErrorZ and ShowUpperErrorZ control the visibility of the Z dimension errors.
Please note that the X errors can be enabled only when the UseXValues property is set to true. Similarly, the Z errors can be enabled only when the UseZValues property is set to true.
The size of the error bar "whiskers" can be controlled through the SizeX, SizeY, and SizeZ properties. The sizes are specified in model units.
Related Examples
Windows forms: Chart Gallery\Error Bar\...
See Also