In This Topic
A Funnel Chart is similar to a Stacked Percent Bar Chart with only one category. It represents 100% of the summary values for the data items included in the chart. Funnel Charts are often used to represent stages in a sales process and show the amount of potential revenue for each stage. This type of chart can also be useful in identifying potential problem areas in an organization’s sales processes. The following figures represent a 2D and a 3D Funnel Charts.
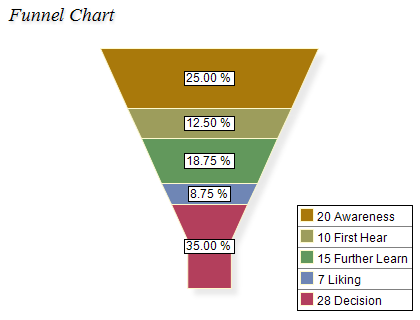
Figure 1.
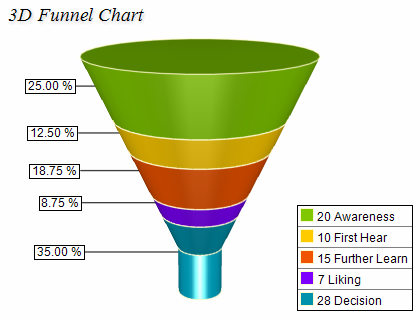
Figure 2.
Creating a funnel series
Funnel series are represented by the NFunnelSeries type. An instance of this type must be added to the series collection of a Funnel Chart (NFunnelChart object).
| C# |
Copy Code
|
// clear the Charts collection and create a new funnel chart
NFunnelChart chart = new NFunnelChart();
chartControl.Charts.Clear();
chartControl.Charts.Add(chart);

// add a funnel series to the funnel chart
NFunnelSeries funnel = (NFunnelSeries)chart.Series.Add(SeriesType.Funnel);
|
| Visual Basic |
Copy Code
|
' clear the Charts collection and create a new funnel chart
Dim chart As New NFunnelChart
chartControl.Charts.Clear()
chartControl.Charts.Add(chart)

' add a funnel series to the funnel chart
Dim funnel As NFunnelSeries = chart.Series.Add(SeriesType.Funnel)
|
Passing Data
Once the funnel series is created you can add some data in it. Funnel series use the Values data series of its base class for the primary funnel values. In addition the funnel series provides a data series of type Double, which holds the x sizes of the funnel data items. It is accessible through the XSizes property of the NFunnelSeries object.
You can either manipulate directly the Values and XSizes data series, or use the data point interface to add data. The NFunnelDataPoint class provides several constructors that can be very helpful when you add data points. Please refer to the Working with Data Points topic for more information.
Standard funnel chart
The standard funnel chart is represented as an intersected cone placed over a cylinder. The dimensions of the cylindrical part (the funnel neck) can be defined in percents of the chart width / height with the help of the
NeckWidthPercent and
NeckHeightPercent properties. The gap between the data points can be set in model units through the
FunnelPointGap property.
Funnel with custom X sizes
Nevron Chart for .NET can display a funnel chart with custom x sizes of the data items. In order to display such a chart you have to set the UseXSizes property to true, and fill the XSizes data series with appropriate values. Please note that when the funnel chart operates in such mode, the last data point is not displayed and only its X Size value is used. It is recommended to set the Y value of the last data point to 0. The following image displays a funnel chart with custom X sizes.
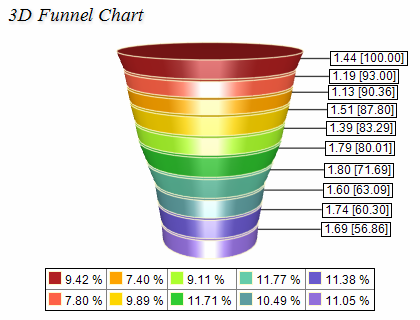
figure 2.
Related Examples
Windows forms: Chart Gallery\Funnel\...
See Also