In This Topic
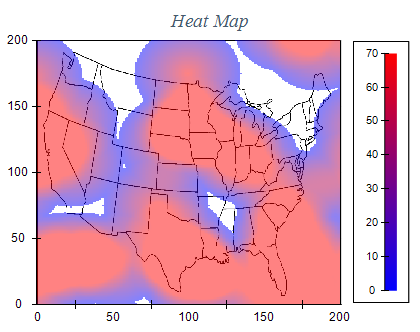
A heat map is a 2D representation of data where the individual values are contained in a matrix and are represented as colors, which are taken from an associated palette. The following pictures shows a typical heat map charts:
Creating a Heat Map
You create a heat map series by creating an instance of the NHeatMapSeries class and then adding it to the series collection of the chart. The following code shows how to create a simple heat map series with some data:
| C# |
Copy Code
|
|
// get the cartesian chart created by default
NChart chart = nChartControl1.Charts[0];
// create a heat map series
NHeatMapSeries heatMap = new NHeatMapSeries();
chart.Series.Add(heatMap);
// add some dummy data
heatMap.Data.SetGridSize(3, 3);
for (int x = 0; x < 3; x++)
{
for (int y = 0; y < 3; y++)
{
heatMap.Data.SetValue(x, y, x * y);
}
}
|
| Visual Basic |
Copy Code
|
|
' get the Cartesian chart created by default
Dim chart As NChart = NChartControl1.Charts(0)
' create a heat map series
Dim heatMap As New NHeatMapSeries()
chart.Series.Add(heatMap)
' add some dummy data
heatMap.Data.SetGridSize(3, 3)
For x As Integer = 0 To 2
For y As Integer = 0 To 2
heatMap.Data.SetValue(x, y, x * y)
Next y
Next x
|
Adding Data
The heat map data is represented by a two dimensional matrix where cells hold some value that is later mapped trough a specified palette. In order to pass data to the heat map you must first initialize the matrix dimensions using the
SetGridSize method of the heat map data object. In the above code this is achieved with the following line of code:
| C# |
Copy Code
|
|
heatMap.Data.SetGridSize(3, 3);
|
| Visual Basic |
Copy Code
|
|
heatMap.Data.SetGridSize(3, 3)
|
Now you have a matrix which is three cells wide and tall. By default each matrix cell width and height are set to one logical unit. You can change that using the OriginX, OriginY, StepX, StepY, XValuesMode and YValuesMode properties. The following example shows how to make the grid cell to occupy two logical units instead of one:
| C# |
Copy Code
|
|
heatMap.XValuesMode = HeatMapValuesMode.OriginAndStep;
heatMap.OriginX = 2;
heatMap.StepX = 2;
heatMap.YValuesMode = HeatMapValuesMode.OriginAndStep;
heatMap.OriginY = 2;
heatMap.StepY = 2;
|
| VB.NET |
Copy Code
|
|
heatMap.XValuesMode = HeatMapValuesMode.OriginAndStep
heatMap.OriginX = 2
heatMap.StepX = 2
heatMap.YValuesMode = HeatMapValuesMode.OriginAndStep
heatMap.OriginY = 2
heatMap.StepY = 2
|
The following table shows the values of the HeatMapValuesMode enum:
| HeatMapValuesMode |
Description |
| Natural |
The heat map data maps each cell to one logical unit. |
| OriginAndStep |
The heat map data maps each cell to logical units using the following formula cell_begin = cell_index * cell_size + cell_origin, where cell_size is specified by StepX or StepY and cell_origin is specified by the OriginX and OriginY properties. |
After you initialize the grid dimensions you can get and set values in the grid using the SetValue and GetValue methods of the data object. The following line of code assigns the value of 10 to the first heat map grid cell:
| C# |
Copy Code
|
|
heatMap.Data.SetValue(0, 0, 10);
|
| Visual Basic |
Copy Code
|
|
heatMap.Data.SetValue(0, 0, 10)
|
Heat Map Palette
The color assigned to each heat map grid cell is computed using the palette assigned to the heat map series, which is accessible from the Palette property. The following code shows how to create a simple custom palette which maps the values from 0 to 10 to shades of gray, where 0 is mapped to black and 10 to white:
| C# |
Copy Code
|
|
heatMap.Palette.Mode = PaletteMode.Custom;
heatMap.Palette.Clear();
heatMap.Palette.SmoothPalette = true;
heatMap.Palette.Add(0, Color.Black);
heatMap.Palette.Add(10, Color.White);
|
| Visual Basic |
Copy Code
|
|
heatMap.Palette.Mode = PaletteMode.Custom
heatMap.Palette.Clear()
heatMap.Palette.SmoothPalette = True
heatMap.Palette.Add(0, Color.Black)
heatMap.Palette.Add(10, Color.White)
|
The double.NaN value is always mapped to transparent color. This allows you to define holes or missing values in the heat map grid.
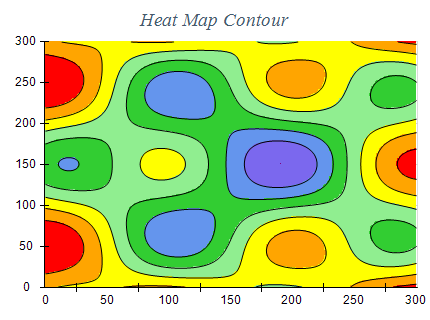
Contour Lines
The heat map series has the ability to show contour lines. In order to show contour lines for different value levels you need to first assign a proper palette - usually this is a palette in custom mode like in the above code examples.
Then you need to enable contour lines using the ContourDisplayMode property:
| C# |
Copy Code
|
|
heatMapSeries.ContourDisplayMode = ContourDisplayMode.Contour;
|
| Visual Basic |
Copy Code
|
|
heatMapSeries.ContourDisplayMode = ContourDisplayMode.Contour
|
The following table shows the available options:
| ContourDisplayMode |
Description |
| None |
Contour lines are not shown. This is the default. |
| Contour |
Displays the connected contours. |
| Dots |
Displays the contour points as dots. The dot size is controlled from the ContourDotSize property. |
When contour lines are visible you can also control their stroke and color. This is achieved from the ContourStroke and ContourColorMode properties. The latter accepts values from the ENContourColorMode enum:
| ENContourColorMode |
Description |
| Uniform |
The contours are displayed with stroke style taken from the ControurStrokeStyle property. |
| Palette |
The contours are displayed with stroke taken from the ControurStroke property and color taken from the associated palette for the controur level. |
Contour Labels
The heat map series can display labels at the contour lines that show their value. The contour labels functionality is controlled from the ContourLabelStyle property of the control. The following code shows how to enable contour labels:
| C# |
Copy Code
|
| heatMap.ContourLabelStyle.Visible = true; |
| Visual Basic |
Copy Code
|
| heatMap.ContourLabelStyle.Visible = True |
In addition you can modify other parameters of the controur labels such as whether they should clip the contour, whether to allow flipping, their formatting and others. The following code snippet shows how to modify several commonly used contour label properties:
| C# |
Copy Code
|
|
heatMap.ContourLabelStyle.Visible = true;
heatMap.ContourLabelStyle.AllowLabelToFlip = false;
heatMap.ContourLabelStyle.LabelDistance = new NLength(50);
heatMap.ContourLabelStyle.Format = "<value>";
heatMap.ContourLabelStyle.TextStyle.FillStyle = new NColorFillStyle(Color.Red);
|
| Visual Basic |
Copy Code
|
heatMap.ContourLabelStyle.Visible = True
heatMap.ContourLabelStyle.AllowLabelToFlip = False
heatMap.ContourLabelStyle.LabelDistance = New NLength(50)
heatMap.ContourLabelStyle.Format = "<value>"
heatMap.ContourLabelStyle.TextStyle.FillStyle = New NColorFillStyle(Color.Red) |
Heat Map Legend
As with all series the heat map has an associated legend. It provides special treatment for the SeriesLegendMode.SeriesLogic legend mode. When set in this mode the heat map can display information about the coloring in table or gradient axis legend mode. For example:
| C# |
Copy Code
|
|
heatMap.Legend.Mode = SeriesLegendMode.SeriesLogic;
heatMap.Legend.PaletteLegendMode = PaletteLegendMode.GradientAxis;
heatMap.Legend.PaletteScaleStepMode = PaletteScaleStepMode.SynchronizeWithScaleConfigurator;
|
| Visual Basic |
Copy Code
|
|
heatMap.Legend.Mode = SeriesLegendMode.SeriesLogic;
heatMap.Legend.PaletteLegendMode = PaletteLegendMode.GradientAxis;
heatMap.Legend.PaletteScaleStepMode = PaletteScaleStepMode.SynchronizeWithScaleConfigurator;
|
Related Examples
Windows forms: Chart Gallery\Heat Map\
Wpf: Chart Gallery\Heat Map\
Web Forms: Chart Gallery\Heat Map\
See Also