In This Topic
A Polar Range chart displays ranges in a polar coordinate system. Each range is specified by its begin and end value and its begin and end angle. The following figure displays a Polar Range chart.
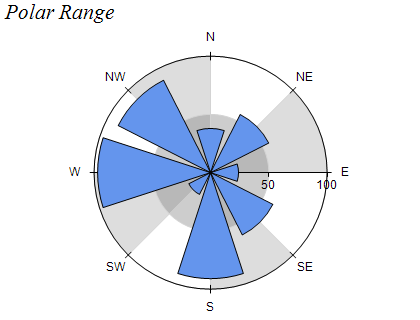
Figure 1.
Creating a Polar Range series
Polar Range series are represented by the NPolarRangeSeries type. An instance of this type must be added to the series collection of a Polar Chart (NPolarChart object).
| C# |
Copy Code
|
// clear the Charts collection and create a new polar chart
NPolarChart chart = new NPolarChart();
nChartControl1.Charts.Clear();
nChartControl1.Charts.Add(chart);
// add a polar range series to the chart
NPolarRangeSeries polarRange = new NPolarRangeSeries();
chart.Series.Add(polarRange);
|
| Visual Basic |
Copy Code
|
' clear the Charts collection and create a new polar chart
Dim chart As New NPolarChart
NChartControl1.Charts.Clear()
NChartControl1.Charts.Add(chart)
' add a polar range series to the chart
Dim polarRange As New NPolarRangeSeries
chart.Series.Add(polarRange)
|
Passing Data
Once the series is created you can add some data in it. Polar range series use the Values, Y2Values to specify begin/end values and Angles and X2Values to specify the range begin/end angle. The following code snippet adds a range to a polar range chart:
| C# |
Copy Code
|
|
polarRange.Values.Add(0);
polarRange.Y2Values.Add(10);
polarRange.Angles.Add(0);
polarRange.X2Values.Add(90);
|
| Visual Basic |
Copy Code
|
|
polarRange.Values.Add(0)
polarRange.Y2Values.Add(10)
polarRange.Angles.Add(0)
polarRange.X2Values.Add(90)
|
Formatting commands
Besides the standard formatting commands you can use the following commands in format strings:
<angle_in_degrees> - the current data point begin angle in degrees (extracted from the Angles data series)
<angle_in_radians> - the current data point begin angle in radians (extracted from the Angles data series)
<angle2_in_degrees> - the current data point end angle in degrees (extracted from the X2Values data series)
<angle2_in_radians> - the current data point end angle in radians (extracted from the X2Values data series)
Related Examples
Windows forms: Chart Gallery\Polar\Polar Range