In This Topic
The Range series can display 2D or 3D shapes defined by the begin / end values of their bounding boxes. It can be used for display of histograms, bars with custom sizes, 3D ranges etc. The following charts are created with the help of the Range series:
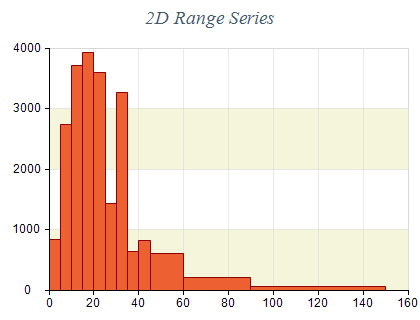
Figure 1.
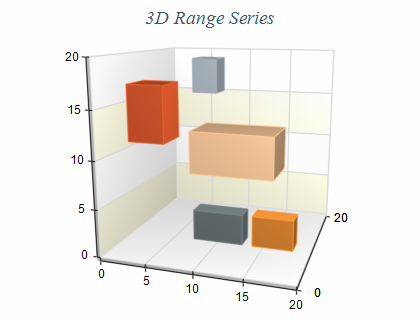
Figure 2.
Creating a range series
Range series are represented by the NRangeSeries type. An instance of this type must be added to the series collection of a Cartesian chart.
| C# |
Copy Code
|
// obtain a reference to the Cartesian chart that is created by default
NCartesianChart chart = (NCartesianChart)chartControl.Charts[0];

// add a range series to it
NRangeSeries range = (NRangeSeries)chart.Series.Add(SeriesType.Range);
|
| Visual Basic |
Copy Code
|
' obtain a reference to the Cartesian chart that is created by default
Dim chart As NCartesianChart = chartControl.Charts(0)

' add a range series to it
Dim range As NRangeSeries = chart.Series.Add(SeriesType.Range)
|
Passing Data
Once the range series is created you can add some data in it. Range series use the following data series:
Values data series - contains the Y range begin values
XValues data series - contains the X range begin values
ZValues data series - contains the Z range begin values
Y2Values data series - contains the Y range end values
X2Values data series - contains the X range end values
Z2Values data series - contains the Z range end values
You can either manipulate directly these data series, or use the data point interface to add data. The NRangeDataPoint class provides several constructors that can be very helpful when you add range data points. Please refer to the Working with Data Points topic for more information.
Controlling the shape
The shape of the data points can be controlled through the Shape property. It accepts values from the BarShape enumeration. For example the following code will display the shapes as smooth edge bars:
| C# |
Copy Code
|
shapeSeries.Shape = BarShape.SmoothEdgeBar;
|
| Visual Basic |
Copy Code
|
shapeSeries.Shape = BarShape.SmoothEdgeBar
|
Related Examples
Windows forms: Chart Gallery\Range\...
See Also