In This Topic
Renko charts display series of white and black boxes (bricks) to illustrate general price movement and trend reversals. A Renko chart is constructed by placing a brick in the next column once the price surpasses the top or bottom of the previous brick by a predefined amount. White bricks are used when the direction of the trend is up, black bricks are used when the trend is down. All bricks are equal in size. This type of chart helps traders to identify key support/resistance levels. The following figure displays a Renko chart.
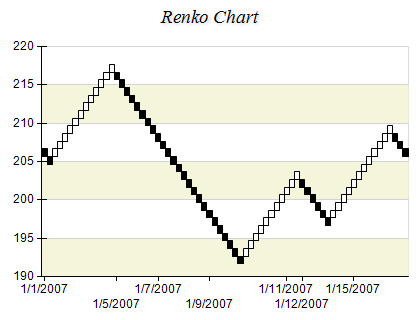
Figure 1.
Creating a Renko series
To display a Renko chart you have to create an instance of the NRenkoSeries type and add it to the series collection of a Cartesian chart.
Renko series can be displayed only in 2D mode only.
| C# |
Copy Code
|
// obtain a reference to the Cartesian chart that is created by default
NChart chart = chartControl.Charts[0];

// create a Renko series
NRenkoSeries series = new NRenkoSeries();

// add the series to the chart series collection
chart.Series.Add(series);
|
| Visual Basic |
Copy Code
|
' obtain a reference to the Cartesian chart that is created by default
Dim chart As NChart = chartControl.Charts(0)

' create a Renko series
Dim series As New NRenkoSeries

' add the series to the chart series collection
chart.Series.Add(series)
|
Passing Data
Once the Renko series is created you can add some data in it. Renko series use the Values data series for price values and the XValues data series for date-time values associated with the prices. The date-time values are used only for annotation of the X axis and do not influence the actual X positions of the data points.
Please note, that Renko chart transforms the data before displaying it and there is no direct correspondence between values and displayed data points.
Configuring the X Axis Scale
The X axis can be set to display date-time labels with the help of a special scale configurator. You have to assign an instance of the
NPriceScaleConfigurator type to the
ScaleConfigurator property of the X axis. The date-time values must be filled in the
XValues data series of the Renko series and the
UseXValues property must be set to true. The scale configurator will automatically extract the date-time information for the axis labels from the Renko series.
Renko Options
The BoxSize property defines the size of the Renko bricks. Price movements are filtered if they are smaller than the box size. The box size can be specified as a fixed value or in percents of the difference between highest and lowest price. Set the BoxSizeInPercents property to true in order to specify the size in percents.
Related Examples
Chart Gallery\Renko\...
See Also