In This Topic
Smooth Line charts are similar to Line charts, the difference being that the successive data points are connected with cubic spline segments instead of straight lines. The following images display Smooth Line charts.
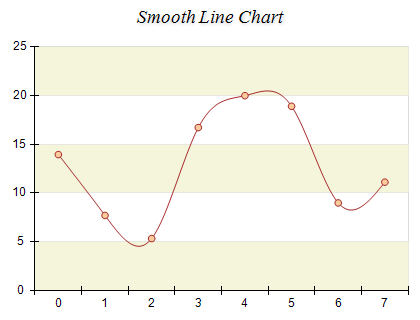

Figure 1.
Creating a smooth line series
Smooth Line series are represented by the NSmoothLineSeries type. An instance of this type must be added to the series collection of a Cartesian chart.
| C# |
Copy Code
|
// obtain a reference to the Cartesian chart that is created by default
NCartesianChart chart = (NCartesianChart)chartControl.Charts[0];

// add a smooth line series to it
NSmoothLineSeries smoothline = (NSmoothLineSeries)chart.Series.Add(SeriesType.SmoothLine);
|
| Visual Basic |
Copy Code
|
' obtain a reference to the Cartesian chart that is created by default
Dim chart As NCartesianChart = chartControl.Charts(0)

' add a smooth line series to it
Dim smoothline As NSmoothLineSeries = chart.Series.Add(SeriesType.SmoothLine)
|
Passing Data
Once the smooth line series is created you can add some data in it. Smooth line series use the
Values data series for elevation values, the
XValues data series - for x position values and the
ZValues data series for depth position values. You can either manipulate directly these data series, or use the data point interface to add data. Please refer to the
Working with Data Points topic for more information.
Controlling the interpolation
It is often required to place the data points at custom positions along the x axis. If you set the UseXValues property to true the smooth line will use the custom x coordinates specified in the XValues data series. In this case you are able to select the spline interpolation method with the help of the Use1DInterpolationForXYScatter property. If this property is set to true, the elevation values are regarded as a function of the x values. This means that there is always only one Y for every X coordinate. When the property is set to false, the line is interpolated as a free 2D line in the XY plane. The following figures show two curves produced from the same data, but with different interpolation methods.
| Demonstration of different interpolation modes |
| 1D interpolation |
2D interpolation |
 |
 |
Related Examples
Chart Gallery\Smooth Line\Standard Smooth Line
Chart Gallery\Smooth Line\DateTime Smooth Line
Chart Gallery\Smooth Line\XY Scatter Smooth Line
Chart Gallery\Smooth Line\XYZ Scatter Smooth Line
See Also