In This Topic
Step Line charts are similar to Line charts, the difference being that the successive data points are connected with horizontal and vertical segments instead of straight lines. The following figures display a 2D and a 3D step line charts:
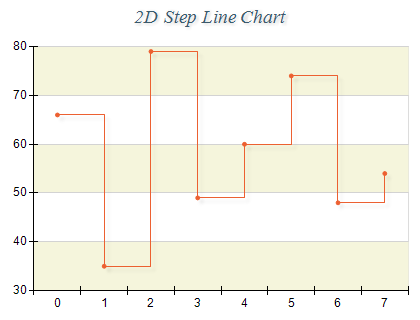
Figure 1.
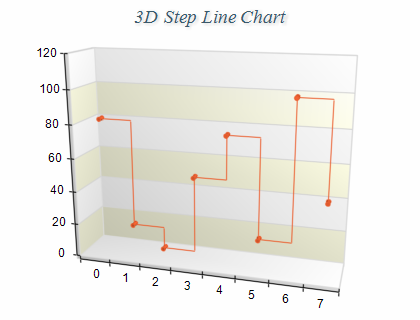
Figure 2.
Creating a step line series
Step Line series are represented by the NStepLineSeries type. An instance of this type must be added to the series collection of a Cartesian chart.
| C# |
Copy Code
|
// obtain a reference to the Cartesian chart that is created by default
NCartesianChart chart = (NCartesianChart)chartControl.Charts[0];

// add a step line series to it
NStepLineSeries stepline = (NStepLineSeries)chart.Series.Add(SeriesType.StepLine);
|
| Visual Basic |
Copy Code
|
' obtain a reference to the Cartesian chart that is created by default
Dim chart As NCartesianChart = chartControl.Charts(0)

' add a step line series to it
Dim stepline As NStepLineSeries = chart.Series.Add(SeriesType.StepLine)
|
Passing Data
Once the step line series is created you can add some data in it. Step line series use the
Values data series for elevation values, the
XValues data series - for x position values and the
ZValues data series for depth position values. You can either manipulate directly these data series, or use the data point interface to add data. Please refer to the
Working with Data Points topic for more information.
Controlling the line shape
The line segments can be visualized with different shapes. You can control the shape with the help of the LineSegmentShape property which accepts values from the LineSegmentShape enumeration. By default the series is displayed as simple line. The following example will display the series as tape:
| C# |
Copy Code
|
stepline.LineSegmentShape = LineSegmentShape.Tape;
|
| Visual Basic |
Copy Code
|
stepline.LineSegmentShape = LineSegmentShape.Tape
|
Controlling the line depth
When a standard step line chart is displayed in Tape, Tube or Ellipsoid mode, the DepthPercent property of the NStepLineSeries object specifies the depth of the line segments in percents of the floor grid cells. By default it is set to 50. The following code will make the line bigger in depth:
| C# |
Copy Code
|
stepline.DepthPercent = 60;
|
| Visual Basic |
Copy Code
|
stepline.DepthPercent = 60
|
In case of XYZ scatter step line the depth is controlled through the LineSize property of the NStepLineSeries object.
If the step line series is displayed as a simple line, the width of the line is controlled through the stroke style of the current data point.
Related Examples
Windows forms: All Examples\Chart Gallery\StepLine\...
See Also