In This Topic
Vector charts display arrows in 2D or 3D space. A vector data item is defined by two points (begin - end) and is represented by a single arrow. An arrowhead is placed at the end point to indicate the vector direction. The following figures show a 2D and a 3D vector field created with the vector series:
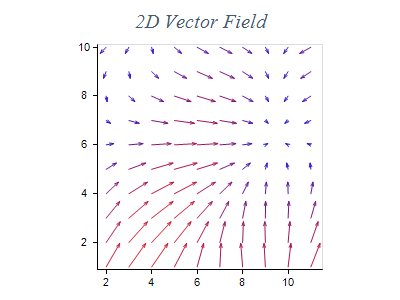
Figure 1.
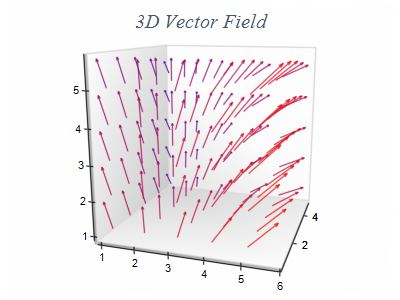
Figure 2.
Creating a Vector Series
Vector series are represented by the NVectorSeries type. An instance of this type must be added to the series collection of a Cartesian chart.
| C# |
Copy Code
|
// obtain a reference to the Cartesian chart that is created by default
NCartesianChart chart = (NCartesianChart)chartControl.Charts[0];

// add a vector series to it
NVectorSeries vector = (NVectorSeries)chart.Series.Add(SeriesType.Vector);
|
| Visual Basic |
Copy Code
|
' obtain a reference to the Cartesian chart that is created by default
Dim chart As NCartesianChart = chartControl.Charts(0)

' add a vector series to it
Dim vector As NVectorSeries = chart.Series.Add(SeriesType.Vector)
|
Passing Data
Once the vector series is created you can add some data in it. Vector series use the following data series:
Values data series - contains the Y values of the begin points
XValues data series - contains the X values of the begin points
ZValues data series - contains the Z values of the begin points
Y2Values data series - contains the Y values of the end points
X2Values data series - contains the X values of the end points
Z2Values data series - contains the Z values of the end points
You can either manipulate directly these data series, or use the data point interface to add data. The NRangeDataPoint class provides several constructors that can be very helpful when you add vector data points. Please refer to the Working with Data Points topic for more information.
Vector Direction Mode
The vector series has a vector display mode in which the vector size on the screen is not formed by the ending X2, Y2 coordinates of the vector. Instead the vector size is calculated in a similar way as the bubble size - the vector [X2, Y2] point is used to a determine the vector direction and the vector length is remapped trough the a vector size scale which is defined by the MinVectorLength and MaxVectorLength properties. For example if you have a vector series where the minimum length in logical coordinates is 0.1 and the maximum is 1 then the minimum vector length (0.1) will be displayed with the vector length specified by MinVectorLength and the maximum vector length (1) will be displayed with the length specified by the MaxVectorLength property. This feature allows you to visualize vector fields that have very small vector lengths. The following code shows how to enable this feature:
| C# |
Copy Code
|
vectorSeries.Mode = VectorSeriesMode.Direction;
vectorSeries.MinVectorLength = new NLength(1);
vectorSeries.MaxVectorLength = new NLength(10);
|
| Visual Basic |
Copy Code
|
vectorSeries.Mode = VectorSeriesMode.Direction
vectorSeries.MinVectorLength = New NLength(1)
vectorSeries.MaxVectorLength = New NLength(10)
|
Vector Size Scale
The vector series has a special legend display mode in which it can display a size scale on the legend. This feature allows the user to have a visual representation of the vector sizes. The following code shows how to enable this feature:
| C# |
Copy Code
|
vectorSeries.Mode = VectorSeriesMode.Direction;
vectorSeries.MinVectorLength = new NLength(1);
vectorSeries.MaxVectorLength = new NLength(10);
|
| Visual Basic |
Copy Code
|
vectorSeries.Mode = VectorSeriesMode.Direction;
vectorSeries.MinVectorLength = new NLength(1);
vectorSeries.MaxVectorLength = new NLength(10);
|
Controlling the vector arrowheads
The width and height of an arrowhead are relative to the vector length, so that shorter vectors can have smaller arrowheads and longer vectors can have larger arrowheads. The sizes are controlled through the ArrowheadWidthFactor and ArrowheadHeightFactor properties. The MinArrowHeadSize and MaxArrowHeadSize properties can be used to set minimum and maximum sizes in NLength format.
Related Examples
Windows forms: Chart Gallery\Vector\...
See Also