3D Charts
In This Topic
When you create a chart panel by default it will display in 2D. All charting types support 3D mode with the exception of the Venn, Polar and Radar charting types. This topic discusses how to switch a chart from 2D to 3D and also outlines some important considerations that you must have in mind when working in 3D mode. The code examples in this topic will use a cartesian chart, but the discussed properties and considerations are also valid for the other charting types that support 3D (Pie and Funnel).
Switching a chart in 3D mode
In order to switch a chart in 3D mode you need to set the Enable3D property of the chart panel to true. The following code will switch the default cartesian chart in 3D mode:
| C# |
Copy Code
|
|
NChart chart = nChartControl1.Charts[0];
chart.Enable3D = true;
|
| Visual Basic |
Copy Code
|
|
Dim chart As NChart = NChartControl1.Charts(0)
chart.Enable3D = True
|
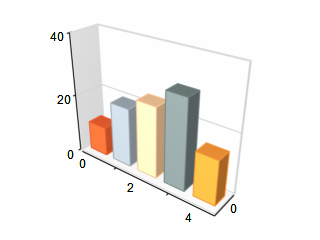
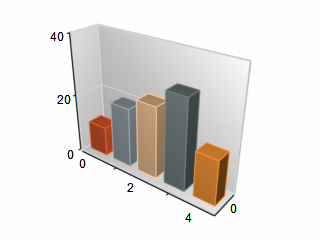
Now the chart will display in 3D. When the chart is operating in 3D mode you can also modify it's projection and lighting. Note that lighting will change the original colors you specify for data items, walls etc., because it will combine these colors with the light sources you apply on the chart scene. The following two pictures show a simple bar chart rendered with different lighting settings:
| Cartesian chart with soft lighting |
Cartesian chart with metallic lighting |
 |
 |
For more information on lighting you can check out the Working with Lights topic that discusses how lighting works and how to apply different lighting schemes to your charts.
Chart Projection
The chart panel has a property called Projection that exposes an object of type NProjection. This property allows you to control the chart projection when operating in 3D mode. The following code will apply a predefined projection to the default cartesian chart of the control:
| C# |
Copy Code
|
|
NChart chart = nChartControl1.Charts[0];
chart.Enable3D = true;
chart.Projection.SetPredefinedProjection(PredefinedProjection.PerspectiveTilted);
|
| Visual Basic |
Copy Code
|
|
Dim chart As NChart = NChartControl1.Charts(0)
chart.Enable3D = True
chart.Projection.SetPredefinedProjection(PredefinedProjection.PerspectiveTilted)
|
Chart Content Fitting
When you switch a chart in 3D mode it will not try to fit it's content into the content area defined by the panel. You can modify this behavior in several modes with the help of the BoundsMode and Fit3DAxisContent properties. The first one defines how the chart box should be fitted in the content area and the second one indicates whether the axis content size (labels, ticks and ruler) should be regarded as well. The following code shows how to force the chart to position itself completely into the content area defined by the panel:
| C# |
Copy Code
|
|
NCartesianChart chart = (NCartesianChart)nChartControl1.Charts[0];
chart.Enable3D = true;
chart.BoundsMode = BoundsMode.Fit;
chart.Fit3DAxisContent = true;
|
| Visual Basic |
Copy Code
|
|
Dim chart As NCartesianChart = CType(NChartControl1.Charts(0), NCartesianChart)
chart.Enable3D = True
chart.BoundsMode = BoundsMode.Fit
chart.Fit3DAxisContent = True
|
Related Examples
Windows forms: Axes\General\Axis Labels Orientation
Windows forms: Visual Effects\General\Lights
Web forms: Axes\General\Axis Labels Orientation
See Also