Jittering (or blurring) is a technique used in 3D to antialias the whole chart scene. The idea behind it is very simple and this why this special visual effect is so effective. Instead of rendering the scene only once the control renders it several times and produces different image samples. All these samples have a small offset along the X and Y directions. These samples are then added together with weight coefficients calculated by using the following formula:
Weight percent = 100 / Number of samples
Jittering is controlled throught the JitterMode property of NSettings accepting values of the JitterMode enumeration. The following table describes the meaning of each mode:
| JitterMode | Description |
| Auto |
The control will automatically jitter the chart content after waiting for a period of inactivity controlled by the AutoJitterInterval property. This is the default setting. Note: In WebForms applications this setting is equivalent to JitterMode.Enabled. |
| Enabled | The control will jitter the chart content at each repaint. |
| Disabled | The control will not jitter the chart repaint. |
The following code snippet will turn off jittering:
| C# |
Copy Code
|
|---|---|
chartControl.Settings.JitterMode = JitterMode.Disabled; |
|
| Visual Basic |
Copy Code
|
|---|---|
chartControl.Settings.JitterMode = JitterMode.Disabled |
|
The number of samples generated to produce the jittered image is specified with the help of the JitteringSteps property of the NSettings object. By default the value of this property is 4 and it accepts values in the range [2, 16]. For example the following line of code will increase the number of jittering samples used to produce the final image:
| C# |
Copy Code
|
|---|---|
chartControl.Settings.JitteringSteps = 8; |
|
| Visual Basic |
Copy Code
|
|---|---|
chartControl.Settings.JitteringSteps = 8 |
|
By default all the deviations of the samples along the X and Y axes are smaller than 1 pixel, but you can control the deviation factor by using the JitteringDeviation property of the NSettings object:
| C# |
Copy Code
|
|---|---|
chartControl.Settings.JitteringDeviation = 3; // set the deviation to three pixels
|
|
| Visual Basic |
Copy Code
|
|---|---|
chartControl.Settings.JitteringDeviation = 3 ' set the deviation to three pixels
|
|
| A bubble chart with no jittering. The bubble edge is jagged. |
|---|
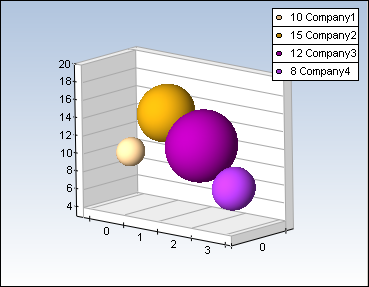 |
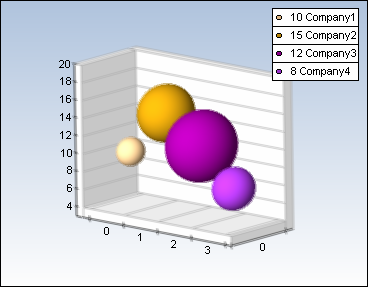
| A bubble chart with jittering. 4 samples and deviation 1. The bubble edge is now antialiased. |
 |
| A bubble chart with jittering. 4 samples and deviation 3. The image looks blurred. |
 |
As you can see from the table above jittering in conjunction with big deviation and more jittering samples leads to a blurred image and this is why jittering can be considered as a form of a blurring effect.
The control does not jitter 2d objects like texts, legends and labels. As every antialiasing effect jittering reduces the performance of the control. The performance downfall is proportional to the number of jittering samples. For example if you apply a jittering effect with 4 samples to the scene the control will render approximately 4 times slower than without jittering. To improve performance you may consider to decrease as much as possible the number of jittering samples. For example a value of 4 jittering samples delivers good quality at a comparatively low performance cost.
Typically you may consider using jittering in applications where the quality of the generated image is more important than the speed - such examples are low traffic web servers and high-end presentations.