Scale Breaks
In This Topic
Scale breaks allow you to skip a range of data on the axis thereby increasing the visual space available for the data that falls outside this range. This feature is most commonly used in the following cases:
- When you have to display data that varies greatly in magnitude.
- When you need to reduce the effect that several large values (peaks in data) have on the scaling of the rest of data.
- When you want to skip data that is of no interest in order to focus on the rest of the data.
Nevron Chart has complete support for scale breaks on all types of axes (horizontal, vertical, depth, reversed, date time etc.) in both 2D and 3D mode and allows you to have full control over the scale break position and style.
Each axis scale can contain an unlimited number of scale breaks, which are created by adding instances of NScaleBreak derived classes as shown by the following table:
|
Type
|
Description
|
|
NAutoScaleBreak
|
Represents one or more scale breaks dynamically introduced to the scale if data displayed on it varies in magnitude above a specified threshold value.
|
|
NCustomScaleBreak
|
Represents a custom defined scale break that will effectively skip the specified range of the data from the scale.
|
Automatic Scale Breaks
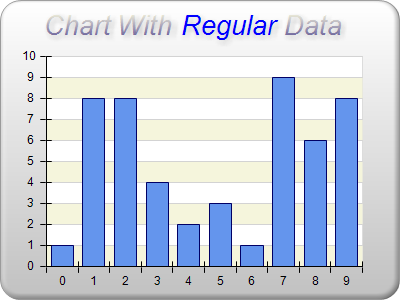
Automatic scale breaks will appear on the scale only if the data displayed on the axis contains large gaps. For example consider the following charts:
- Chart with data that is regularly distributed over the scale range
- Chart with data which is located in the range [0, 1] and [9, 9.5]
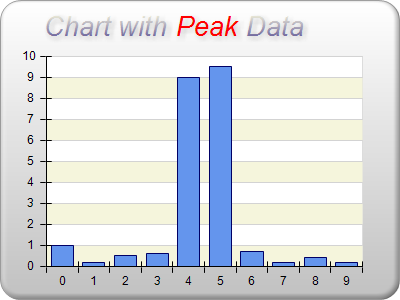
The effect of peak data is that it greatly increases the scale range of the axis (in the above case the Y axis), which in turn decreases the amount of space available for data whose values don’t vary greatly (in the above case these are the values in the range [0, 1]. This effect reduces the readability of the chart since you cannot visually distinguish the difference between the data in the small range.
To solve this problem you may want to introduce an automatic scale break that will appear when the data contains peaks. In order to do so you need to create an object of type NAutoScaleBreak and add it to the ScaleBreaks collection property of the scale configurator associated with the axis. The following code snippet shows how to achieve this:
| C# |
Copy Code
|
NChart chart = (NChart)nChartControl1.Charts[0];
NAxis axis = chart.Axis((int)StandardAxis.PrimaryY);

NStandardScaleConfigurator scale = axis.ScaleConfigurator as NStandardScaleConfigurator;
scale.ScaleBreaks.Add(new NAutoScaleBreak());
|
| Visual Basic |
Copy Code
|
Dim chart As NChart = CType(NChartControl1.Charts(0), NChart)
Dim axis As NAxis = chart.Axis(CType(StandardAxis.PrimaryY, Integer))

Dim scale As NStandardScaleConfigurator = CType(axis.ScaleConfigurator, NStandardScaleConfigurator)
scale.ScaleBreaks.Add(New NAutoScaleBreak())
|
This will produce the following chart:
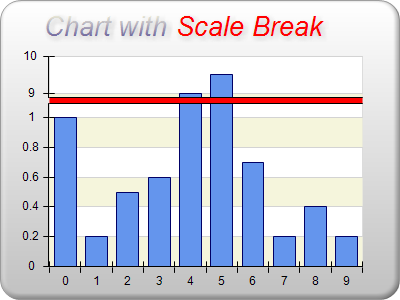
Note that now it’s much easier to distinguish the differences in the data contained in the range [0.2, 1], because the chart has allocated more visual space to it at the expense of the data in the range [1, 9].
Threshold Factor
The ThresholdFactor property of the NAutoScaleBreak class allows you to control when scale breaks will appear. The threshold is calculated as follows:
threshold = DataGapRangeLength / DataRangeLength
In the case of the above chart the gap in data occurs from [1, 9] (there is no data in that range) and the data range is [0.2, 9.5] (all data is contained in this range). Therefore the threshold is:
8 / 9.3 = 0.96
By default the automatic scale break will be displayed when the threshold is above 0.4 and this is why the scale break will appear given the above data set. To following code shows how to change the value of this property:
| C# |
Copy Code
|
NChart chart = (NChart)nChartControl1.Charts[0];
NAxis axis = chart.Axis((int)StandardAxis.PrimaryY);

NStandardScaleConfigurator scale = axis.ScaleConfigurator as NStandardScaleConfigurator;
NAutoScaleBreak autoScaleBreak = new NAutoScaleBreak();
autoScaleBreak.ThresholdFactor = 0.8f;
scale.ScaleBreaks.Add(autoScaleBreak);
|
| Visual Basic |
Copy Code
|
Dim chart As NChart = CType(NChartControl1.Charts(0), NChart)
Dim axis As NAxis = chart.Axis(CType(StandardAxis.PrimaryY, Integer))

Dim scale As NStandardScaleConfigurator = CType(axis.ScaleConfigurator, NStandardScaleConfigurator)
Dim autoScaleBreak As New NAutoScaleBreak()
autoScaleBreak.ThresholdFactor = 0.8F
scale.ScaleBreaks.Add(autoScaleBreak)
|
Auto Scale Break Count
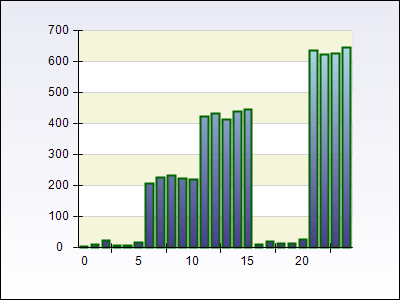
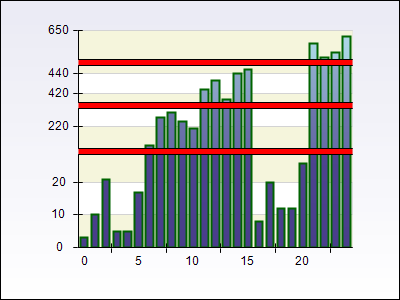
When the threshold value is small you may have several gaps in data that satisfy the specified threshold. In this case the automatic scale break will create scale breaks starting from the biggest gap until the number of scale breaks reaches the MaxScaleBreakCount property of the NAutoScaleBreak class or there are no more gaps that satisfy the threshold factor. The following pictures show how a chart will behave when this property is set to to 3:
|
Original Chart
|
|
|
|
The same chart with three scale breaks
|
|
|
Custom Scale Breaks
In some cases you may want to manually add scale breaks to the axis scale. This is done by creating and instance of the NCustomScaleBreak and adding it to the ScaleBreaks collection of the scale configurator:
| C# |
Copy Code
|
NChart chart = (NChart)nChartControl1.Charts[0];
NAxis axis = chart.Axis((int)StandardAxis.PrimaryY);

NStandardScaleConfigurator scale = axis.ScaleConfigurator as NStandardScaleConfigurator;
NCustomScaleBreak customScaleBreak = new NCustomScaleBreak(new NRange1DD(15, 25));
scale.ScaleBreaks.Add(customScaleBreak);
|
| Visual Basic |
Copy Code
|
Dim chart As NChart = CType(NChartControl1.Charts(0), NChart)
Dim axis As NAxis = chart.Axis(CType(StandardAxis.PrimaryY, Integer))

Dim scale As NStandardScaleConfigurator = CType(axis.ScaleConfigurator, NStandardScaleConfigurator)
Dim customScaleBreak As NCustomScaleBreak = New NCustomScaleBreak(New NRange1DD(15, 25))
scale.ScaleBreaks.Add(customScaleBreak)
|
Scale Break Position
Each scale break (be it custom or automatic) has a property called Position which accepts object derived from the abstract NScaleBreakPosition class. This feature allows you to control where the scale break will appear on the scale. The following table shows the possible options for this property:
|
Class
|
Description
|
|
NPercentScaleBreakPosition
|
Represents a scale break position which is determined in percentages relative to the scale being split by the scale break.
|
|
NRangeScaleBreakPosition
|
Represents a scale break position which is determined relative to the range of the scale break on the scale.
|
|
NContentScaleBreakPosition
|
Represents a scale break position, which is determined according to the amount of data left on the sides of the scale break.
|
Percent Scale Break Position
The percent scale break position allows you to place the scale break at a specified percent value of the scale segment it splits. For example when you use the following code:
| C# |
Copy Code
|
NChart chart = (NChart)nChartControl1.Charts[0];
NAxis axis = chart.Axis((int)StandardAxis.PrimaryY);

NStandardScaleConfigurator scale = axis.ScaleConfigurator as NStandardScaleConfigurator;
NCustomScaleBreak customScaleBreak = new NCustomScaleBreak(new NRange1DD(15, 25));
customScaleBreak.Position = new NPercentScaleBreakPosition(50);
scale.ScaleBreaks.Add(customScaleBreak);
|
| Visual Basic |
Copy Code
|
Dim chart As NChart = CType(NChartControl1.Charts(0), NChart)
Dim axis As NAxis = chart.Axis(CType(StandardAxis.PrimaryY, Integer))

Dim scale As NStandardScaleConfigurator = CType(axis.ScaleConfigurator, NStandardScaleConfigurator)
Dim customScaleBreak As NCustomScaleBreak = New NCustomScaleBreak(New NRange1DD(15, 25))
customScaleBreak.Position = New NPercentScaleBreakPosition(50)
scale.ScaleBreaks.Add(customScaleBreak)
|
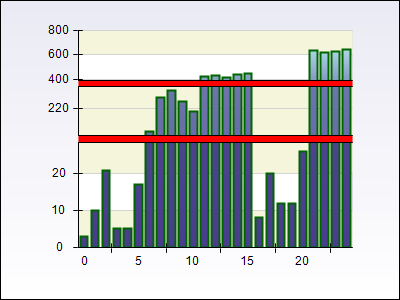
The scale break will be placed at the middle of the chart axis. The following picture shows what happens when you have two scale breaks each positioned at 50% of the scale segment they split respectively:
Range Scale Break Position
In some cases you may want to position the scale break at the place of the range of data it skips so that the user has better visual comprehension of the relative position of the skipped range. In this case you should assign a NRangeScaleBreakPosition object to the Position property:
| C# |
Copy Code
|
NChart chart = (NChart)nChartControl1.Charts[0];
NAxis axis = chart.Axis((int)StandardAxis.PrimaryY);

NStandardScaleConfigurator scale = axis.ScaleConfigurator as NStandardScaleConfigurator;
NCustomScaleBreak customScaleBreak = new NCustomScaleBreak(new NRange1DD(15, 25));
customScaleBreak.Position = new NRangeScaleBreakPosition();
scale.ScaleBreaks.Add(customScaleBreak);
|
| Visual Basic |
Copy Code
|
Dim chart As NChart = CType(NChartControl1.Charts(0), NChart)
Dim axis As NAxis = chart.Axis(CType(StandardAxis.PrimaryY, Integer))

Dim scale As NStandardScaleConfigurator = CType(axis.ScaleConfigurator, NStandardScaleConfigurator)

Dim customScaleBreak As NCustomScaleBreak = New NCustomScaleBreak(New NRange1DD(15, 25))
customScaleBreak.Position = New NRangeScaleBreakPosition()
scale.ScaleBreaks.Add(customScaleBreak)
|
The following picture shows the same chart as with the percent scale break position, except that the scale breaks use range positioning:
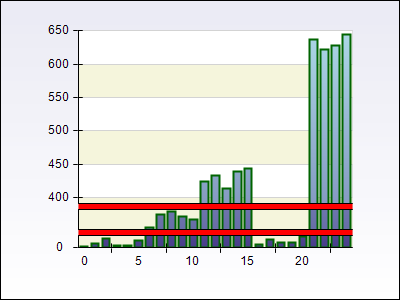
Notice that this time you can visually distinguish how the ranges of important data relate to each other at the expense of the visual space associated with the first two ranges, which get smaller and as a consequence the data contained in them is less readable.
Content Scale Break Position
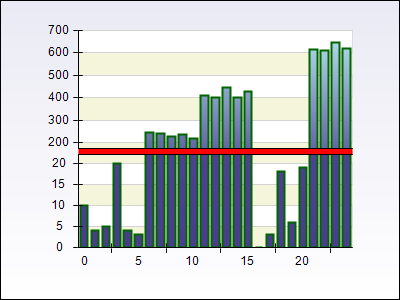
Finally you can let the control to determine how the scale break will split the axis based on the amount of data contained within the ranges that fall outside the scale break. This allows you to allocate more visual space for the ranges that contain more data at the expense of the ranges of data that contain less. The following shows a scale break which is slightly offset to the bottom of the Y axis because the data shown in the range [0, 20] is less than the one shown in the range [200, 700].
Scale Break Inflate
When using scale breaks it is often useful to have some means to instruct the control to slightly inflate the ranges that fall on the left and right sides of the break. This is useful when you want to avoid cutting of the data as shown on the following image:
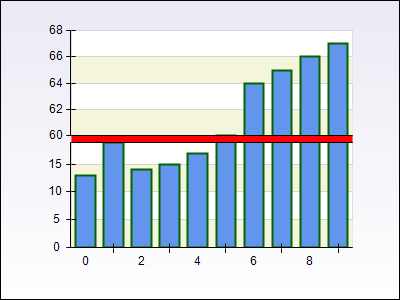
The above image shows an automatic scale break which is introduced in the range [20, 60]. The readability of this chart image is not good as the bars at 20 and 60 fall exactly on the scale break borders. To improve the image you may consider to inflate the ranges [0, 20] and [60, 68] in order to better accumulate the bars at values 20 and 60:
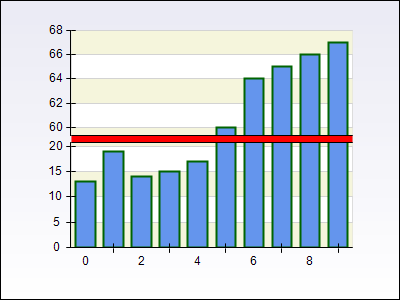
The above image shows a scale break with 10 percent left and right inflate which will shift the range [0, 20] to [0, 22] and the range [60, 68] to [54, 68] or in other words inflate the values of the ranges that are adjacent to the scale break with 10 percent of their length if possible. The following snippet shows how to do this from code:
| C# |
Copy Code
|
scaleBreak.Inflate = new NRelativeScaleBreakInflate(10, 10);
|
| Visual Basic |
Copy Code
|
scaleBreak.Inflate = New NRelativeScaleBreakInflate(10, 10)
|
You can also use absolute inflate which to be applied to the adjacent ranges:
| C# |
Copy Code
|
scaleBreak.Inflate = new NAbsoluteScaleBreakInflate(10, 10);
|
| Visual Basic |
Copy Code
|
scaleBreak.Inflate = New NAbsoluteScaleBreakInflate(10, 10)
|
In this case the ranges [0, 20] and [60, 68] will be shifted to [0, 30] and [50, 68] respectively.
By default automatic scale breaks are configured with ten percent relative inflate and custom scale breaks have no inflate.
Scale Break Style
Each scale break has a property called Style that accepts objects derived from NScaleBreakStyle and allow you to control the appearance of the scale break on the axis. The following table shows the possible options:
All classes derive from the abstract NScaleBreakStyle class that allows you to modify the stroke and filling of a scale break. The following code snippet shows how to create a custom scale break at range [15, 25] and change its stroke and fill styles:
| C# |
Copy Code
|
NChart chart = (NChart)nChartControl1.Charts[0];
NAxis axis = chart.Axis((int)StandardAxis.PrimaryY);

NStandardScaleConfigurator scale = axis.ScaleConfigurator as NStandardScaleConfigurator;
NCustomScaleBreak customScaleBreak = new NCustomScaleBreak(new NRange1DD(15, 25));
customScaleBreak.Style.FillStyle = new NColorFillStyle(Color.Blue);
customScaleBreak.Style.StrokeStyle.Color = Color.DarkBlue;
scale.ScaleBreaks.Add(customScaleBreak);
|
| Visual Basic |
Copy Code
|
Dim chart As NChart = CType(NChartControl1.Charts(0), NChart)
Dim axis As NAxis = chart.Axis(CType(StandardAxis.PrimaryY, Integer))

Dim scale As NStandardScaleConfigurator = CType(axis.ScaleConfigurator, NStandardScaleConfigurator)
Dim customScaleBreak As New NCustomScaleBreak(New NRange1DD(15, 25))
customScaleBreak.Style.FillStyle = New NColorFillStyle(Color.Blue)
customScaleBreak.Style.StrokeStyle.Color = Color.DarkBlue
scale.ScaleBreaks.Add(customScaleBreak)
|
The wave and zig zag scale break styles also allow you to change the pattern of the wave / zig zag respectively. The following code shows how to create a custom scale break with wave style using the free hand wave pattern:
| C# |
Copy Code
|
NChart chart = (NChart)nChartControl1.Charts[0];
NAxis axis = chart.Axis((int)StandardAxis.PrimaryY);

NStandardScaleConfigurator scale = axis.ScaleConfigurator as NStandardScaleConfigurator;
NCustomScaleBreak customScaleBreak = new NCustomScaleBreak(new NRange1DD(15, 25));
NWaveScaleBreakStyle waveStyle = new NWaveScaleBreakStyle();
waveStyle.Pattern = ScaleBreakPattern.FreeHand;
customScaleBreak.Style = waveStyle;
scale.ScaleBreaks.Add(customScaleBreak);
|
| Visual Basic |
Copy Code
|
Dim chart As NChart = CType(NChartControl1.Charts(0), NChart)
Dim axis As NAxis = chart.Axis(CType(StandardAxis.PrimaryY, Integer))

Dim scale As NStandardScaleConfigurator = CType(axis.ScaleConfigurator, NStandardScaleConfigurator)
Dim customScaleBreak As New NCustomScaleBreak(New NRange1DD(15, 25))
Dim waveStyle As New NWaveScaleBreakStyle()
waveStyle.Pattern = ScaleBreakPattern.FreeHand
customScaleBreak.Style = waveStyle
scale.ScaleBreaks.Add(customScaleBreak)
|
See Also


