Kagi
In This Topic
Kagi charts display series of vertical lines to illustrate general levels of supply and demand for certain assets. The thickness and direction of the lines are dependent on the price action. Thick lines are drawn when the price breaks above the previous high price and is interpreted as an increase in demand. Thin lines are used to represent increased supply when the price falls below the previous low. Kagi charts ignore the passage of time. The following figure displays a Kagi chart.
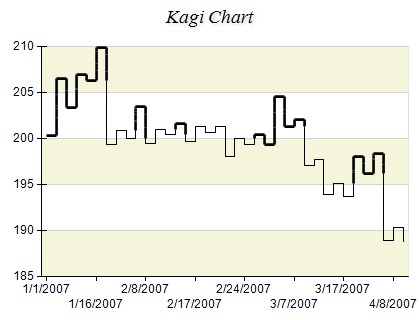
Figure 1.
Creating a Kagi series
To display a Kagi chart you have to create an instance of the NKagiSeries type and add it to the series collection of a Cartesian chart.
Kagi series can be displayed only in 2D mode only.
| C# |
Copy Code
|
// obtain a reference to the Cartesian chart that is created by default
NChart chart = chartControl.Charts[0];

// create a Kagi series
NKagiSeries series = new NKagiSeries();

// add the series to the chart series collection
chart.Series.Add(series);
|
| Visual Basic |
Copy Code
|
' obtain a reference to the Cartesian chart that is created by default
Dim chart As NChart = chartControl.Charts(0)

' create a Kagi series
Dim series As New NKagiSeries

' add the series to the chart series collection
chart.Series.Add(series)
|
Passing Data
Once the Kagi series is created you can add some data in it. Kagi series use the Values data series for price values and the XValues data series for date-time values associated with the prices. The date-time values are used only for annotation of the X axis and do not influence the actual X positions of the data points.
Please note, that Kagi chart transforms the data before displaying it and there is no direct correspondence between values and displayed data points.
Configuring the X Axis Scale
The X axis can be set to display date-time labels with the help of a special scale configurator. You have to assign an instance of the
NPriceScaleConfigurator type to the
ScaleConfigurator property of the X axis. The date-time values must be filled in the
XValues data series of the Kagi series and the
UseXValues property must be set to true. The scale configurator will automatically extract the date-time information for the axis labels from the Kagi series.
Kagi Options
The reversal amount for the Kagi chart can be specified through the ReversalAmount property. Price reversals are ignored if the amount of the change is below the value of the reversal amount. The reversal amount can be specified as a fixed value or as a percent of the current price. Set the ReversalAmountInPercents property to true in order to specify the reversal amount in percents.
Related Examples
Chart Gallery\Kagi\...
See Also