Point
In This Topic
Point Charts display 1, 2 or 3-dimensional data as points in a Cartesian coordinate system. Values are represented by the position of the points on the chart. The following figures display a XY Scatter Point Chart and a XYZ Scatter Point Chart.
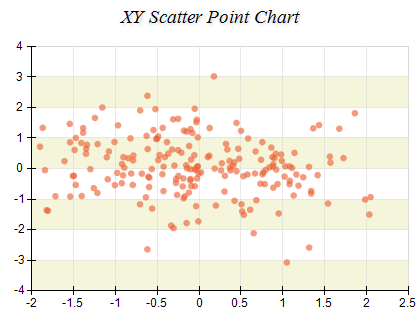
Figure 1.
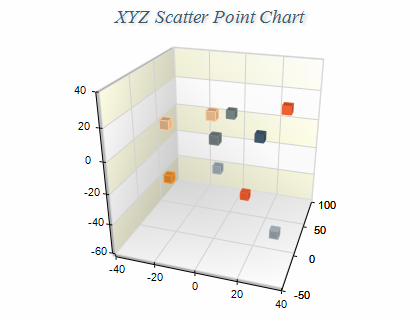
Figure 2.
Creating a point series
Point series are represented by the NPointSeries type. An instance of this type must be added to the series collection of a Cartesian chart.
| C# |
Copy Code
|
// obtain a reference to the Cartesian chart that is created by default
NCartesianChart chart = (NCartesianChart)chartControl.Charts[0];

// add point series to it
NPointSeries point = (NPointSeries)chart.Series.Add(SeriesType.Point);
|
| Visual Basic |
Copy Code
|
' obtain a reference to the Cartesian chart that is created by default
Dim chart As NCartesianChart = chartControl.Charts(0)

' add point series to it
Dim point As NPointSeries = chart.Series.Add(SeriesType.Point)
|
Passing Data
Once the point series is created you can add some data in it. Point series use the
Values data series for elevation values, the
XValues data series - for x position values and the
ZValues data series for depth position values. You can either manipulate directly these data series, or use the data point interface to add data. Please refer to the
Working with Data Points topic for more information.
Controlling the points shape
The shape of the point segments can be controlled from the PointShape property. It accepts values from the PointShape enumeration. For example the following code will display the points as pyramids:
| C# |
Copy Code
|
point.PointShape = PointShape.Pyramid;
|
| Visual Basic |
Copy Code
|
point.PointShape = PointShape.Pyramid
|
By default the PointShape property is set to Bar. The size of the points is controlled through the Size property, which is of type NLength. The point size can be specified as percentage of the chart size:
| C# |
Copy Code
|
point.Size = new NLength(1, NRelativeUnit.ParentPercentage);
|
| Visual Basic |
Copy Code
|
point.Size = New NLength(1, NRelativeUnit.ParentPercentage)
|
Clustering
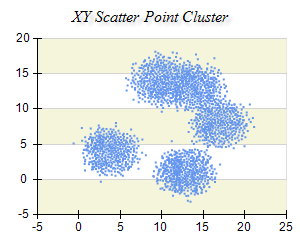
The point series supports a special rendering mode called clustered rendering, which allows you to render very large data sets. Clustering works by identifying densely populated regions of data, which are later visualized by a single point. This reduces the number of visual points on the screen and therefore improves performance. When you use clustering the point series will not regard settings for markers, data points, individual fill styles and shadow.
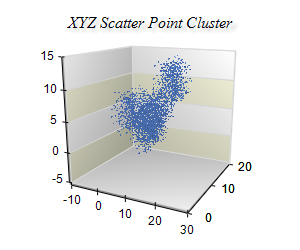
The following two pictures show a clustered point chart in 2D and 3D containing 100, 000 data points each.
| XY Scatter Point Chart with 100K Data Points |
XYZ Scatter Point Chart with 100K Data Points |
 |
 |
You enable clustering by setting the ClusterMode property of the points series to Enabled. The following table lists the available options:
| Cluster Mode |
Description |
| Auto |
Clustering is automatically enabled when the number of data points exceeds the value of AutoClusterThreshold, which by default is set to 10000. This is the default setting. |
| Enabled |
Clustering is always enabled regardless of the number of data points. |
| Disabled |
The points series will not use clustering regardless of the number of data points. |
When rendering in clustered mode the point series will also regard the value of the ClusterBranchingFactor. This property controls how the internal cluster tree representing the cluster will grow when you add data points. Higher values for this property will reduce the memory footprint of the cluster, but will slow down the building speed and vice versa. By default this property is set to 10.
The ClusterDistanceFactor property controls the maximum distance between two data points if they are to be merged in a cluster. By default this property is set to 0.01, meaning that the cluster will roughly approximate each hundred points with a single point on a screen (the actual number of cluster points is not guaranteed and depends on the density of the data in different regions of the model space). Higher values for this property will diminish the number of visual points, but will decrease the precision of the cluster and vice versa.
The following code snippets show to to enable clustering and to modify the default precision of the cluster:
| C# |
Copy Code
|
|
NPointSeries point = new NPointSeries();
point.ClusterMode = ClusterMode.Enabled;
point.ClusterDistanceFactor = 0.005;
|
| Visual Basic |
Copy Code
|
|
Dim point As New NPointSeries
point.ClusterMode = ClusterMode.Enabled
point.ClusterDistanceFactor = 0.005
|
Drop Lines
The point series allows you to display drop lines which extend from the point to the plane of the horizontal, vertical or depth axis. This feature allows the user to better see the position of the point versus the relative axis. The following code snippets show how to enable drop lines:
| C# |
Copy Code
|
point.ShowHorizontalDropLines = true;
point.ShowVerticalDropLines = true;
point.ShowDepthDropLines = true; |
| Visual Basic |
Copy Code
|
point.ShowHorizontalDropLines = True
point.ShowVerticalDropLines = True
point.ShowDepthDropLines = True |
You can also modify whether the drop lines extend to the scale min, max or custom specfiied value. This is achieved by using the HorizontalDropLineOrigin, VerticalDropLineOrigin and DepthDropLineOriginMode properties. The following code snippet shows how to change the drop line orgin to a custom value:
| C# |
Copy Code
|
point.HorizontalDropLineOriginMode = DropLineOriginMode.CustomValue;
point.HorizontalDropLineOrigin = 10; |
| Visual Basic |
Copy Code
|
point.HorizontalDropLineOriginMode = DropLineOriginMode.CustomValue
point.HorizontalDropLineOrigin = 10 |
Related Examples
Windows forms: Chart Gallery\Point\Standard Point
Windows forms: Chart Gallery\Point\XY Scatter Point
Windows forms: Chart Gallery\Point\XY Scatter Point Cluster
Windows forms: Chart Gallery\Point\XYZ Scatter Point Cluster
See Also