Shape Series
In This Topic
The Shape series can display objects with custom positions and sizes along the X, Y and Z axes. It can be used for rendering of custom chart types and composite objects. The following scene is rendered with the help of several shape series.
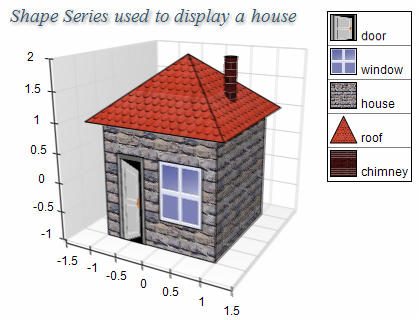
Figure 1.
Creating a shape series
Shape series are represented by the NShapeSeries type. An instance of this type must be added to the series collection of a Cartesian chart.
| C# |
Copy Code
|
// obtain a reference to the Cartesian chart that is created by default
NCartesianChart chart = (NCartesianChart)chartControl.Charts[0];

// add a shape series to it
NShapeSeries shapeSeries = (NShapeSeries)chart.Series.Add(SeriesType.Shape);
|
| Visual Basic |
Copy Code
|
' obtain a reference to the Cartesian chart that is created by default
Dim chart As NCartesianChart = chartControl.Charts(0)

' add a shape series to it
Dim shapeSeries As NShapeSeries = chart.Series.Add(SeriesType.Shape)
|
Passing Data
Once the shape series is created you can add some data in it. Shape series use the Values data series for elevation values, the XValues data series - for x position values and the ZValues data series for depth position values. In addition to these data series the shape series provides the following data series of type Double:
XSizes - holds the size of the shapes in the X dimension
YSizes - holds the size of the shapes in the Y dimension
ZSizes - holds the size of the shapes in the Z dimension
You can either manipulate directly these data series, or use the data point interface to supply data to the series. The NShapeDataPoint class provides several constructors that can be very helpful when you add data points. Please refer to the Working with Data Points topic for more information.
Controlling the shape
The shape of the data points can be controlled from the Shape property. It accepts values from the BarShape enumeration. For example the following code will display the shapes as smooth edge bars:
| C# |
Copy Code
|
shapeSeries.Shape = BarShape.SmoothEdgeBar;
|
| Visual Basic |
Copy Code
|
shapeSeries.Shape = BarShape.SmoothEdgeBar
|
Shape Size Units
The size of a shape along the X,Y and Z dimensions can be specified in scale or in model units. By default it is specified in scale units, which means that the actual size of the shape may decrease if the range scaled by the axes is increased. A common requirement for shapes is to have a size independent of the axis scale. For example a XYZ scatter bubble should have its sizes specified in this way.
The XSizesUnits, YSizesUnits and ZSizesUnits properties of the NShapeSeries class help you specify the type of units that you use for the shape sizes. They are of type MeasurementUnits and accept the Scale and Model settings.
Formatting Commands
The NShapeSeries class extends the formatting commands set inherited from the NXYZScatterSeries base class with the following formatting commands:
<xsize> - the current data point x size (size along the X dimension)
<ysize> - the current data point y size (size along the Y dimension)
<zsize> - the current data point z size (size along the Z dimension)
The following code will display the shape sizes in the legend:
| C# |
Copy Code
|
shapeSeries.Legend.Mode = SeriesLegendMode.DataPoints;
shapeSeries.Legend.Format = "<xsize> <ysize> <zsize>";
|
| Visual Basic |
Copy Code
|
shapeSeries.Legend.Mode = SeriesLegendMode.DataPoints
shapeSeries.Legend.Format = "<xsize> <ysize> <zsize>"
|
Related Examples
Windows forms: Chart Gallery\Shape\Standard Shape
Windows forms: Chart Gallery\Shape\3D Modeling with shapes
See Also