Grid Surface
In This Topic
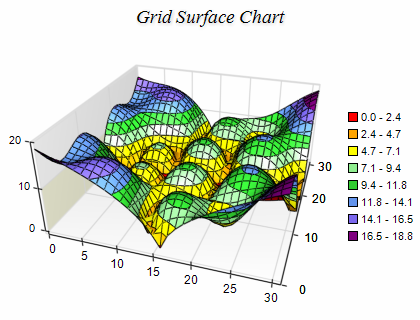
The Grid Surface chart displays a surface with user-defined elevation values for each data point and with X and Y coordinates which form a rectangular grid. Grid Surface series are represented by the NGridSurfaceSeries type. The following figure displays a typical grid surface chart.
Creating a Grid Surface Series
To create a grid surface you have to create an instance of the NGridSurfaceSeries type and add it to the series collection of the chart. Surface series can be displayed only in 3D mode, so it is required to enable 3D for the chart hosting the series:
| C# |
Copy Code
|
|
// obtain a reference to the Cartesian chart that is created by default
NChart chart = nChartControl1.Charts[0];
// switch in 3D
chart.Enable3D = true;
// set aspect 1:1:1
chart.Width = 50;
chart.Height = 50;
chart.Depth = 50;
// set projection
chart.Projection.SetPredefinedProjection(PredefinedProjection.PerspectiveTilted);
// create a surface series
NGridSurfaceSeries surface = new NGridSurfaceSeries();
// add the series to the chart series collection
chart.Series.Add(surface);
|
| VB.NET |
Copy Code
|
|
' obtain a reference to the Cartesian chart that is created by default
Dim chart As NChart = NChartControl1.Charts(0)
' switch in 3D
chart.Enable3D = True
' set aspect 1:1:1
chart.Width = 50
chart.Height = 50
chart.Depth = 50
' set projection
chart.Projection.SetPredefinedProjection(PredefinedProjection.PerspectiveTilted)
' create a surface series
Dim surface As New NGridSurfaceSeries
' add the series to the chart series collection
chart.Series.Add(surface)
|
Grid Surface Data
The surface elevation data is managed with the help of an NGridSurfaceData object, which is accessible through the Data property of the NGridSurfaceSeries class. The data is stored in a two-dimensional array of data points, where each data point has only one double value (the elevation value). The size of the surface is controlled with the help of the SetGridSize method of the NGridSurfaceData class. It accepts two integer parameters - sizeX (defines the width of the surface) and sizeZ (defines the depth of the surface). The SetValue method sets a value at a specified X and Z index. The supplied value will be converted to System.Single. If you need to specify an invalid data point at some position you have to use DBNull.Value or float.NaN instead of an actual value. The following example creates a grid surface series with 9 data points (4 segments) and fills some data in it.
| C# |
Copy Code
|
// obtain a reference to the Cartesian chart that is created by default
NChart chart = nChartControl1.Charts[0];
// switch in 3D
chart.Enable3D = true;
// set aspect 1:1:1
chart.Width = 50;
chart.Height = 50;
chart.Depth = 50;
// set projection
chart.Projection.SetPredefinedProjection(PredefinedProjection.PerspectiveTilted);

// create a surface series
NGridSurfaceSeries surface = new NGridSurfaceSeries();
chart.Series.Add(surface);
surface.FrameMode = SurfaceFrameMode.Mesh;
surface.Name = "Grid Surface";
// add some data
surface.Data.SetGridSize(3, 3);
surface.Data.SetValue(0, 0, 0.8);
surface.Data.SetValue(1, 0, 0.0);
surface.Data.SetValue(2, 0, 0.0);
surface.Data.SetValue(0, 1, 1.0);
surface.Data.SetValue(1, 1, 1.2);
surface.Data.SetValue(2, 1, 0.5);
surface.Data.SetValue(0, 2, 4.0);
surface.Data.SetValue(1, 2, 2.0);
surface.Data.SetValue(2, 2, 1.3);
|
| Visual Basic |
Copy Code
|
' obtain a reference to the Cartesian chart that is created by default
Dim chart As NChart = NChartControl1.Charts(0)
' switch in 3D
chart.Enable3D = True

' set aspect 1:1:1
chart.Width = 50
chart.Height = 50
chart.Depth = 50
' set projection
chart.Projection.SetPredefinedProjection(PredefinedProjection.PerspectiveTilted)
' create a surface series
Dim surface As New NGridSurfaceSeries
chart.Series.Add(surface)
surface.FrameMode = SurfaceFrameMode.Mesh
surface.Name = "Grid Surface"
' add some data
surface.Data.SetGridSize(3, 3)
surface.Data.SetValue(0, 0, 0.8)
surface.Data.SetValue(1, 0, 0.0)
surface.Data.SetValue(2, 0, 0.0)
surface.Data.SetValue(0, 1, 1.0)
surface.Data.SetValue(1, 1, 1.2)
surface.Data.SetValue(2, 1, 0.5)
surface.Data.SetValue(0, 2, 4.0)
surface.Data.SetValue(1, 2, 2.0)
surface.Data.SetValue(2, 2, 1.3)
|
The following figure displays the generated surface as well as the order of X and Z indices in a surface grid.
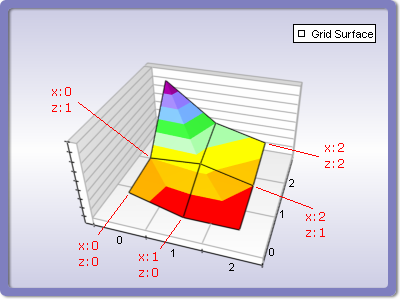
The GetValue method helps you read the value at the specified X and Z indices. It returns either an object of type System.Double or DBNull.Value (in case of invalid value). The GridSizeX and GridSizeZ properties can be used to retrieve respectively the current X and Z size of the surface data.
Grid Surface With Custom Colors
When the grid surface operates in CustomColors fill mode you also need to pass a color for each vertex. This is achieved using the SetColor method of the grid surface data object - for example:
| C# |
Copy Code
|
|
surface.Data.UseColors = true;
surface.Data.SetColor(0, 0, Color.Red);
|
| Visual Basic |
Copy Code
|
|
surface.Data.UseColors = True
surface.Data.SetColor(0, 0, Color.Red)
|
Passing Large Amounts of Data
In addition to the SetValue and SetColor methods you can feed data to the grid surface by accessing its internal values and colors (in case the surface uses custom colors). The data is stored in an interleaved byte array so you'll have to use unsafe code to do this. The following code shows how to modify data directly in memory:
| C# |
Copy Code
|
|
// create a surface series
NGridSurfaceSeries gridSurface = new NGridSurfaceSeries();
// add the series to the chart series collection
chart.Series.Add(gridSurface);
gridSurface.Data.UseColors = true;
gridSurface.Data.SetGridSize(10, 10);
unsafe
{
fixed (byte* pData = &gridSurface.Data.Data[0])
{
int dataItemSize = gridSurface.Data.DataItemSize;
float* gridValues = (float*)pData;
uint* gridColors = (uint*)(pData + gridSurface.Data.ColorOffset);
gridValues[0 * dataItemSize] = 10; // same as calling SetValue(0, 0, 10);
gridValues[1 * dataItemSize] = 20; // same as calling SetValue(1, 0, 20);
gridValues[10 * dataItemSize] = 20; // same as calling SetValue(0, 1, 20);
gridColors[0 * dataItemSize] = 0xFF0000; // same as calling SetColor(0, 0, Color.Blue);
gridColors[1 * dataItemSize] = 0x00FF00; // same as calling SetColor(1, 0, Color.Green);
gridColors[10 * dataItemSize] = 0x0000FF; // same as calling SetColor(0, 1, Color.Red);
}
}
// notify the surface that data has changed
gridSurface.Data.OnDataChanged();
|
Surface cell triangulation
A grid cell is defined by four neighboring data points which form a square. Each grid cell can be triangulated in two alternative ways, depending on which pairs of points are connected with a diagonal. The selection of a diagonal is called cell triangulation. The grid surface supports several modes for cell triangulation. The default mode is MaxSum, which means that the points with maximum sum of the elevations are connected with a diagonal. The triangulation mode can be controlled through the CellTriangulationMode property. It accepts values from the SurfaceCellTriangulationMode enumeration.
Isolines
The grid surface series can display lines with specified elevation and stroke style (isolines). The following code shows how to display an isoline at some value:
| C# |
Copy Code
|
|
NSurfaceIsoline isoline = new NSurfaceIsoline();
isoline.Value = 10;
isoline.StrokeStyle = new NStrokeStyle(1, Color.Red);
gridSurface.Isolines.Add(isoline);
|
| Visual Basic |
Copy Code
|
|
Dim isoline As New NSurfaceIsoline
isoline.Value = 10
isoline.StrokeStyle = New NStrokeStyle(1, Color.Red)
gridSurface.Isolines.Add(isoline)
|
Related Examples
Windows forms: Chart Gallery\Grid Surface\...
Wpf: Chart Gallery\Grid Surface\...
Web Forms: Chart Gallery\Grid Surface\...
See Also