Nevron .NET Vision
Chart for .NET / User's Guide / Data Manipulation / Functions / Functions Overview

In This Topic
    Functions Overview
    In This Topic

    Nevron Chart for .NET offers a powerful and flexible library for calculation of various mathematical, statistical and financial functions. It has more than 50 built-in functions as well as an easy mechanism for combining them into more complex formulas.

     Calculating Functions

    Functions are defined and calculated with the help of the NFunctionCalculator class. You have to create an instance of this class in order to use functions:

    C#
    Copy Code
    NFunctionCalculator functionCalc = new NFunctionCalculator();
    
    Visual Basic
    Copy Code
    Dim functionCalc As NFunctionCalculator = New NFunctionCalculator()
    

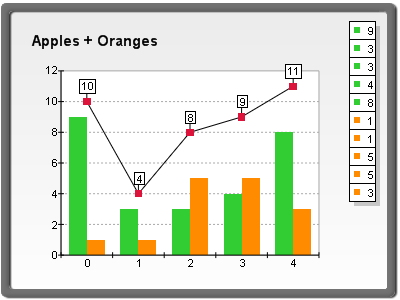
    The second step is to define the data sources (arguments) for the function, which actually contain the input data for the calculation. The arguments are ordinary NDataSeries objects - most often the "Values" data series of some existing chart series (for example Line or Bar). To inform the function calculator that an NDataSeries object will participate in the function calculation you have to add it to the Arguments collection. The following code demonstrates this, assuming that bar1 and bar2 are NBarSeries objects, which are already added to the chart.

    C#
    Copy Code
    bar1.Values.Name = "Apples";
    bar2.Values.Name = "Oranges";
    functionCalc.Arguments.Add(bar1.Values);
    functionCalc.Arguments.Add(bar2.Values);
    
    Visual Basic
    Copy Code
    bar1.Values.Name = "Apples"
    bar2.Values.Name = "Oranges"
    functionCalc.Arguments.Add(bar1.Values)
    functionCalc.Arguments.Add(bar2.Values)
    

    The third step is to define the function that will be calculated. This is done with the help of the Expression property of the function calculator. It is a string, which contains the formula of the function. For this example we will use the ADD function to add the values of the two bar series:

    C#
    Copy Code
    functionCalc.Expression = "ADD( Apples ; Oranges )";
    
    Visual Basic
    Copy Code
    functionCalc.Expression = "ADD( Apples ; Oranges )"
    

    Now the function calculator is ready and the only thing left is to call the Calculate method, which actually produces the result of the function. It returns an NDataSeries object, which contains the result values.

    C#
    Copy Code
    NDataSeries result = functionCalc.Calculate();
    
    Visual Basic
    Copy Code
    Dim result As NDataSeries =  functionCalc.Calculate()
    

    After calling the Calculate method, the "result" data series contains the result of the calculation. The Calculate method can be called multiple times with the same arguments and expression - this is useful when the values in the source data series are changed repeatedly, and you need to calculate a function with the new input values each time.

    In case you have to change the arguments for the function, don't forget to call the functionCalc.Arguments.Clear() method to remove the arguments for the previous calculations.

    When the calculation is done, the result data series can be used in many ways but naturally the most common task is to present the result data into a chart.

     Presenting the function data

    The "result" data series can be presented in the chart easily for example by assigning it to the "Values" data series of a line series (assuming that line1 is an existing NLineSeries object):

    C#
    Copy Code
    line1.Values = result;
    chartControl.Refresh();
    
    Visual Basic
    Copy Code
    line1.Values = result
    chartControl.Refresh()


    figure 1

    Naturally any other charting type can be used to present the function data. The function "ADD", which was used in the example returns an array of values, where each value is equal to the sum of the corresponding values of the input arrays. Some functions do not return an array of values, but a single value - for example the expression "AVERAGE(Apples)" will calculate the average of all values in the "Apples" data series and the result of this operation (the average value) will be the only item in the "result" data series. In such cases it is appropriate to use a constant line to present the value:

    C#
    Copy Code
    NAxisConstLine cl = chart.Axis(StandardAxis.PrimaryY).ConstLines.Add();
    cl.Value = (double)result.GetValueForIndex(0);
    chartControl.Refresh();
    
    Visual Basic
    Copy Code
    Dim cl As NAxisConstLine = chart.Axis(StandardAxis.PrimaryY).ConstLines.Add()
    cl.Value = CType(result.GetValueForIndex(0), Double)
    chartControl.Refresh()


    figure 2

     Expressions and Arguments

    Understanding the function expressions is important, because they define exactly what calculation is performed by the calculator object. The general structure of an expression is the following:

    function_name( argument1; argument2; argument3 ... )

    All the functions use a common syntax, although the type and the count of their arguments vary. The syntax of a function begins with the function name, followed by an opening parenthesis, the arguments for the function separated by semicolons, and a closing parenthesis. In general an argument can be one of the following items:

    • A data series name. When a data series name is encountered in the function formula, this means that the function will use the data series with that name as a data source.

    • A constant. For example "ADD(Apples ; 3.52)" will add the constant 3.52 to each value in the "Apples" array.

    • A function call. Functions can be used as arguments for other functions. When a function is used as an argument, or nested, it is only required that it returns the same type of result that the outer level function needs. Various complex formulas can be composed with the help of the function nesting. For example, the formula of the Root Mean Square is:


    The corresponding expression for this function is:

    "POW( AVERAGE(POW(a;2)) ; 0.5 )"
    

    In this formula 'a' is a data series argument and 'POW' stands for the Power function, which once calculates the square of each element in 'a' and the second time - the square root of the result of the AVERAGE function. In this case we have three levels of nesting.

    Another example for function nesting is the financial function MACD (Moving Average Convergence Divergence). It is defined as the difference between a 26-day and 12-day exponential moving average. The expression for the MACD function is:

    "SUB(EMA(Arg;12); EMA(Arg;26))"
    

    As you noticed, in the previous examples we used function names like "ADD", "POW", "AVERAGE", "EMA" etc. These are some of the built-in functions in the functions library. Currently the library supports more than 50 built-in functions. Each of them is discussed individually in a dedicated topic.


    Note that the function expressions are case sensitive. If a name of an argument contains some characters other than alphabetic characters, digits and underscores, or starts with a digit, then it must be enclosed with curly braces {}. For example the name "Apple Sales" contains a space and cannot be used directly in an expression.

    MUL( Apple Sales ; 2 ) - syntax error
    
    MUL( {Apple Sales} ; 2 ) - correct
    

    Here are some more examples:

    ADD( values_123 ; -3.14 ) - correct
    
    CUMSUM( 123values ) - syntax error (starts with a digit)
    
    CUMSUM( {123values} ) - correct
    
    SUM( data#1 ) - syntax error (contains a non-alpha character)
    
    SUM( {data#1} ) - correct
    

    The data series, which are added to the Arguments collection, must have different names in order to be identified correctly. If you try to add a data series with a name, which already exists in the Arguments collection, an exception will be thrown.