Common Surface Functionality
In This Topic
NSurfaceSeriesBase is the base type for the NGridSurfaceSeries , NMeshSurfaceSeries, NTriangulatedSurfaceSeries and NVertexSurfaceSeries types, which represent different types of surface charts. It provides common functionality for the surface series like surface palette management, control of the surface filling, frame and appearance, flat surface mode etc. When you add a surface series to a chart you should also set the Enable3D property to true, otherwise the surface will not be visualized.
Surface Frame
The NSurfaceSeriesBase object supports several frame modes including: Mesh, Contour, Mesh Contour, Dots and no frame. You can change the frame mode with the help of the FrameMode property, which accepts values from the SurfaceFrameMode enumeration. The following code changes the frame mode to mesh contour:
| C# |
Copy Code
|
surface.FrameMode = SurfaceFrameMode.MeshContour;
|
| Visual Basic |
Copy Code
|
surface.FrameMode = SurfaceFrameMode.MeshContour
|
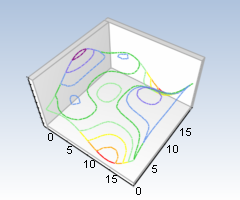
The frame can be rendered with uniform coloring or with palette coloring. This feature is controlled through the FrameColorMode property. If it is set to SurfaceFrameColorMode.Uniform the surface frame is displayed with the color defined by the FrameStrokeStyle property. If it is set to SurfaceFrameColorMode.Zone, the frame is displayed with the current palette colors. The following images demonstrate the different frame styles.
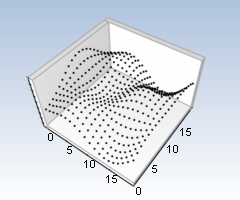
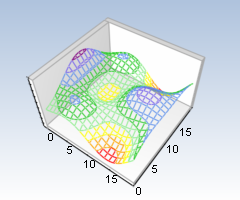
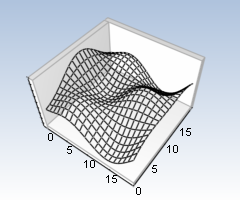
| Surface Frame Styles |
| Contour |
Dots |
 |
 |
| Mesh Contour |
Mesh |
 |
 |
Surface Filling
The surface series support different fill modes like zone filling, zone filling with texture, uniform filling and no filling. The fill mode is controlled through the FillMode property. By default mode is zone filling (the surface is filled with the colors of the current palette, based on the elevation of the surface segments). The following code demonstrates how to disable the filling.
| C# |
Copy Code
|
surface.FillMode = SurfaceFillMode.None;
|
| Visual Basic |
Copy Code
|
surface.FillMode = SurfaceFillMode.None
|
The following image displays a typical zone-filled surface chart.
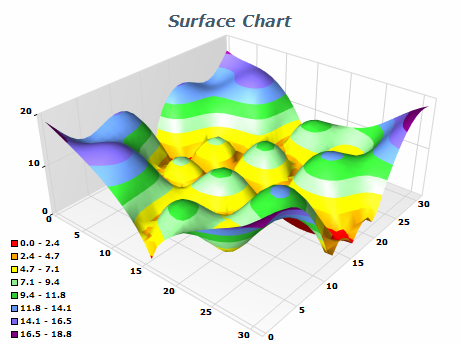
The FillStyle property holds a NFillStyle object, with the help of which you can control the surface transparency, apply gradients, images, patterns and advanced gradients to the surface, as well as modify material properties like emissive color, specular reflection color and shininess. The fill style is merged with the palette colors. If you want to show a surface with some kind of fill style, but without zoning (for example an image mapped on the surface) you have to use Uniform filling mode:
| C# |
Copy Code
|
surface.FillMode = SurfaceFillMode.Uniform;
|
| Visual Basic |
Copy Code
|
surface.FillMode = SurfaceFillMode.Uniform
|
Now you can apply the desired image with the help of an image fill style object.
| C# |
Copy Code
|
surface.FillStyle = new NImageFillStyle("c:\\texture.png");
|
| Visual Basic |
Copy Code
|
surface.FillStyle = New NImageFillStyle("c:\texture.png")
|
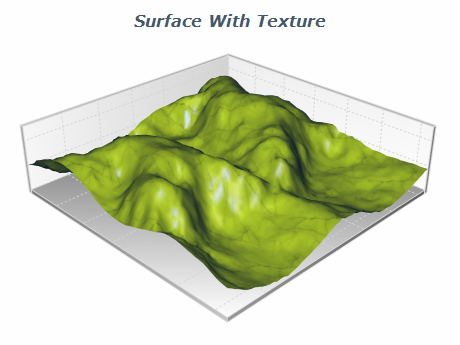
The image below shows a surface with a mapped texture image:
Finally all surface series support color information per vertex. This is specified by setting the FillMode property to CustomColors:
| C# |
Copy Code
|
| surface.FillMode = SurfaceFillMode.CustomColors; |
| Visual Basic |
Copy Code
|
| surface.FillMode = SurfaceFillMode.CustomColors |
Shading Mode
Surface series support two shading modes: flat and smooth. With flat shading the outline of each polygon is clearly visible and the surface looks rough. This mode is appropriate when the surface forms sharp peaks. Smooth shading makes the surface look curved and smooth and in many cases can significantly improve its appearance.
The shading mode is controlled through the ShadingMode property of the series.
Surface Palette
The surface palette defines the colors for the surface filling (when SurfaceFillStyle.Zone is used) as well as the colors for the surface frame when the FrameColorMode property is set to SurfaceFrameColorMode.Zone. By default the surface uses automatically generated palette. The automatic palette can either be synchronized with the axis ticks or a fixed number of palette steps can be defined. The mode is controlled by the boolean property SyncPaletteWithAxisScale. The number of steps is defined by the PaletteSteps property. The following code creates a palette with 4 steps:
| C# |
Copy Code
|
surface.SyncPaletteWithAxisScale = false;
surface.PaletteSteps = 4;
|
| Visual Basic |
Copy Code
|
surface.SyncPaletteWithAxisScale = False
surface.PaletteSteps = 4
|
The advantage of these types of palette filling is that the component will automatically assign colors to values. Sometimes though, you might want to specify exactly the color mapped on a particular elevation. In this case, you can manually set the palette entries. The first step to take in this direction is to turn off the automatic palette.
| C# |
Copy Code
|
surface.AutomaticPalette = false;
|
| Visual Basic |
Copy Code
|
surface.AutomaticPalette = False
|
The Palette property of the NSurfaceSeriesBase returns an NPalette object that helps you deal with palette entries. The NPalette object is a set of elevation values and the corresponding color entries. The following code adds three entries into a palette:
| C# |
Copy Code
|
surface.Palette.Clear();
surface.Palette.Add(10.0, Color.Red);
surface.Palette.Add(20.5, Color.Green);
surface.Palette.Add(40.0, Color.Blue);
|
| Visual Basic |
Copy Code
|
surface.Palette.Clear()
surface.Palette.Add(10.0, Color.Red)
surface.Palette.Add(20.5, Color.Green)
surface.Palette.Add(40.0, Color.Blue)
|
The newly created palette will map red color to value 10.0, green color to value 20.5 and blue color to value 40.0. As you can see one of the advantages of the custom palette is that it can map colors to irregular value intervals. Another useful feature of the surface palette is the smooth palette mode. In this mode the zone colors gradate smoothly from one to another. The following code turns on the smooth palette.
| C# |
Copy Code
|
surface.SmoothPalette = true;
|
| Visual Basic |
Copy Code
|
surface.SmoothPalette = True
|
The following images demonstrate a custom palette with disabled and enabled smooth mode.
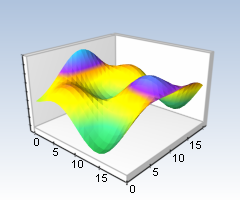
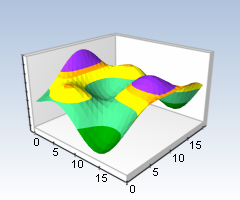
| Smooth and Zoned Surface Palette |
| Smooth Palette |
Zoned Palette |
 |
 |
Contour Chart
The surface series can be displayed in flat surface mode (also known as contour chart). This mode is enabled with the help of the DrawFlat property of the NSurfaceSeriesBase class.
| C# |
Copy Code
|
surface.DrawFlat = true;
|
| Visual Basic |
Copy Code
|
surface.DrawFlat = True
|
You can set the contour at an arbitrary vertical position. Two properties control the vertical position of the contour - PositionMode and PositionValue. The contour can be positioned in three modes: SurfacePositionMode.AxisBegin, SurfacePositionMode.AxisEnd and SurfacePositionMode.CustomValue. When you set the PositionMode property to AxisBegin or AxisEnd the component ignores the PositionValue and places the contour respectively at the min or the max value of the vertical axis. When you set the PositionMode to CustomValue, the contour is positioned at the value specified in PositionValue. The following code positions the surface at value 5.0.
| C# |
Copy Code
|
surface.PositionMode = SurfacePositionMode.CustomValue;
surface.PositionValue = 5.0;
|
| Visual Basic |
Copy Code
|
surface.PositionMode = SurfacePositionMode.CustomValue
surface.PositionValue = 5.0
|
The following images represent contour charts with smooth and zoned palette.
| Contour with Smooth and Zone Palette |
| Zoned Palette |
Smooth Palette |
|
|
Usually contour charts are not displayed in perspective view, but with orthogonal projection with top view position. This can be done easily with the help of a special predefined projection. The following line of code demonstrates this:
| C# |
Copy Code
|
chart.Projection.SetPredefinedProjection(PredefinedProjection.OrthogonalTop);
|
| Visual Basic |
Copy Code
|
chart.Projection.SetPredefinedProjection(PredefinedProjection.OrthogonalTop)
|
Formatting
The surface series support the following formatting commands for the legend item texts:
<zone_value> - palette value (for smooth palette only)
<zone_begin> - begin value of a zone (the lower value)
<zone_end> - second value of a zone (the higher value)
The following formatting commands are supported for the tooltip texts:
<value> - elevation value of a data point
<index> - index of a surface segment
<xindex> - x index of a surface segment
<zindex> - z index of a surface segment
The formatting properties for all elevation values can be controlled through the ValueFormatter property.
Palette Legend
The surface series populates the legend with palette information when the legend mode is SeriesLegendMode.SeriesLogic. If a smooth palette is applied all the palette entries are displayed in the legend. The formatting command that should be used in such case is <zone_value>.
| C# |
Copy Code
|
surface.Legend.Format = "<zone_value>";
|
| Visual Basic |
Copy Code
|
surface.Legend.Format = "<zone_value>"
|
If the smooth palette is turned off the legend displays the zones defined by two successive palette entries (the number of legend items in this case is equal to the number of palette entries minus one). Use the following formatting commands: <zone_begin> for the first value in a zone, <zone_end> for the second value in a zone.
| C# |
Copy Code
|
surface.Legend.Format = "<zone_begin> - <zone_end>";
|
| Visual Basic |
Copy Code
|
surface.Legend.Format = "<zone_begin> - <zone_end>"
|
Shader (GPU only Rendering)
All surfaces by default will use a combination of CPU / GPU rendering, where some of the calculations are performed by the CPU and others are done on the GPU. The advantage of this approach is that computations that can be executed only once are done on the CPU and all the rest is performed on the GPU. In some cases however, for example when you have large dynamically changing data in realtime it is better to perform all calculations on the GPU. To enable this feature you need to set the EnableShaderRendering property to true:
| C# |
Copy Code
|
| surface.EnableShaderRendering = true; |
| Visual Basic |
Copy Code
|
| surface.EnableShaderRendering = True |
Interactivity
The default interactivity features of the surface series are controlled through the
InteractivityStyle property. You can assign individual interactivity styles to particular data points through the
InteractivityStyles property. It exposes a
NIndexedDataSeries collection, in which you can add interactivity styles for specific data point indexes.
See Also