Mesh Surface
In This Topic
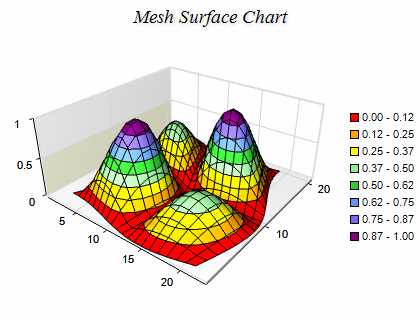
The Mesh Surface chart displays a surface with user-defined elevation, x-position and z-position values for each data point. Data points are ordered in a regular network. Mesh surface series are represented by the NMeshSurfaceSeries type. The following figure displays a Mesh Surface chart.
Creating a Mesh Surface Series
To create a grid surface you have to create an instance of the NMeshSurfaceSeries type and add it to the series collection of the chart. Surface series can be displayed only in 3D mode, so it is required to enable 3D for the chart hosting the series:
| C# |
Copy Code
|
|
// obtain a reference to the Cartesian chart that is created by default
NChart chart = nChartControl1.Charts[0];
// switch in 3D
chart.Enable3D = true;
// set aspect 1:1:1
chart.Width = 50;
chart.Height = 50;
chart.Depth = 50;
// set projection
chart.Projection.SetPredefinedProjection(PredefinedProjection.PerspectiveTilted);
// create a surface series
NMeshSurfaceSeries surface = new NMeshSurfaceSeries();
// add the series to the chart series collection
chart.Series.Add(surface);
|
| VB.NET |
Copy Code
|
|
' obtain a reference to the Cartesian chart that is created by default
Dim chart As NChart = NChartControl1.Charts(0)
' switch in 3D
chart.Enable3D = True
' set aspect 1:1:1
chart.Width = 50
chart.Height = 50
chart.Depth = 50
' set projection
chart.Projection.SetPredefinedProjection(PredefinedProjection.PerspectiveTilted)
' create a surface series
Dim surface As New NMeshSurfaceSeries
' add the series to the chart series collection
chart.Series.Add(surface)
|
Mesh Surface Data
The surface data is managed with the help of an NMeshSurfaceData object, which is accessible through the Data property of the NMeshSurfaceSeries class. The data is stored in a two-dimensional array of data points, where each data point has elevation value, x-position value and z-position value.
The number of surface data points is controlled with the help of the SetGridSize method of the NMeshSurfaceData class. It accepts two integer parameters - sizeX (defines the number of data points in the X dimension) and sizeZ (defines the number of data points in the Z dimension).
The surface data is supplied with the help of the following methods:
SetValueY - for elevation values,
SetValueX - for X-position values,
SetValueZ - for Z-position values.
The SetValue method sets all three values at a specified X and Z index. The supplied values must be of type System.Double. If you need to specify an invalid data point at some position you have to use DBNull.Value instead of a double value. The following example creates a mesh surface series with 9 data points (4 segments) and fills some data in it.
| C# |
Copy Code
|
// obtain a reference to the Cartesian chart that is created by default
NChart chart = nChartControl1.Charts[0];
// switch in 3D
chart.Enable3D = true;
// set aspect 1:1:1
chart.Width = 50;
chart.Height = 50;
chart.Depth = 50;
// set projection
chart.Projection.SetPredefinedProjection(PredefinedProjection.PerspectiveTilted);
// create a surface series
NMeshSurfaceSeries surface = new NMeshSurfaceSeries();
chart.Series.Add(surface);
surface.FrameMode = SurfaceFrameMode.Mesh;
surface.Name = "Mesh Surface";
// add some data
surface.Data.SetGridSize(3, 3);
surface.Data.SetValue(0, 0, 0.8, 0.0, 1.1);
surface.Data.SetValue(1, 0, 0.0, 12.7, 0.0);
surface.Data.SetValue(2, 0, 0.0, 17.0, 1.2);
surface.Data.SetValue(0, 1, 1.0, 5.0, 12.0);
surface.Data.SetValue(1, 1, 1.2, 10.0, 11.0);
surface.Data.SetValue(2, 1, 0.5, 18.0, 10.0);
surface.Data.SetValue(0, 2, 4.0, 2.1, 22.0);
surface.Data.SetValue(1, 2, 2.0, 11.0, 21.0);
surface.Data.SetValue(2, 2, 1.3, 20.0, 20.0);
|
| Visual Basic |
Copy Code
|
' obtain a reference to the Cartesian chart that is created by default
Dim chart As NChart = NChartControl1.Charts(0)
' switch in 3D
chart.Enable3D = True
' set aspect 1:1:1
chart.Width = 50
chart.Height = 50
chart.Depth = 50
' set projection
chart.Projection.SetPredefinedProjection(PredefinedProjection.PerspectiveTilted)
' create a mesh surface series
Dim surface As New NMeshSurfaceSeries
chart.Series.Add(surface)
surface.FrameMode = SurfaceFrameMode.Mesh
surface.Name = "Mesh Surface"
' add some data
surface.Data.SetGridSize(3, 3)
surface.Data.SetValue(0, 0, 0.8, 0.0, 1.1)
surface.Data.SetValue(1, 0, 0.0, 12.7, 0.0)
surface.Data.SetValue(2, 0, 0.0, 17.0, 1.2)
surface.Data.SetValue(0, 1, 1.0, 5.0, 12.0)
surface.Data.SetValue(1, 1, 1.2, 10.0, 11.0)
surface.Data.SetValue(2, 1, 0.5, 18.0, 10.0)
surface.Data.SetValue(0, 2, 4.0, 2.1, 22.0)
surface.Data.SetValue(1, 2, 2.0, 11.0, 21.0)
surface.Data.SetValue(2, 2, 1.3, 20.0, 20.0)
|
The following figure displays the generated surface as well as the order of X and Z indices in a surface grid.
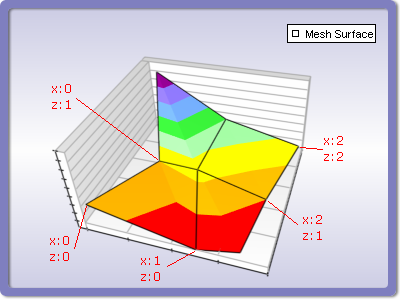
The GetValueY, GetValueX and GetValueZ methods help you read the value at the specified X and Z indices. It returns either an object of type System.Double or DBNull.Value (in case of invalid value). The GridSizeX and GridSizeZ properties can be used to retrieve respectively the current X and Z size of the surface data.
Mesh Surface With Custom Colors
When the mesh surface operates in CustomColors fill mode you also need to pass a color for each vertex. This is achieved using the SetColor method of the mesh surface data object - for example:
| C# |
Copy Code
|
| surface.Data.SetColor(0, 0, Color.Red); |
| Visual Basic |
Copy Code
|
| surface.Data.SetColor(0, 0, Color.Red) |
Passing Large Amounts of Data
In addition to the SetValue and SetColor methods you can feed data to the grid surface by directly accessing its internal data storage. The following code shows how to modify data in this way:
| C# |
Copy Code
|
|
// create a surface series
NMeshSurfaceSeries gridSurface = new NMeshSurfaceSeries();
// add the series to the chart series collection
chart.Series.Add(gridSurface);
gridSurface.Data.UseColors = true;
gridSurface.Data.SetGridSize(10, 10);
unsafe
{
fixed (byte* pData = &meshSurface.Data.Data[0])
{
int dataItemSize = meshSurface.Data.DataItemSize;
float* gridValues = (float*)pData;
uint* gridColors = (uint*)(pData + meshSurface.Data.ColorOffset);
int row = 1;
int col = 1;
int dataPointIndex = meshSurface.Data.RowCount * row + col;
gridValues[dataPointIndex * dataItemSize] = 20; // same as calling SetValueX(1, 1, 20);
gridValues[dataPointIndex * dataItemSize + 1] = 20; // same as calling SetValueY(1, 1, 20);
gridValues[dataPointIndex * dataItemSize + 2] = 20; // same as calling SetValueZ(1, 1, 20);
gridColors[dataPointIndex * dataItemSize] = 0xFF0000; // same as calling SetColor(0, 0, Color.Blue);
}
}
// notify the surface that data has changed
meshSurface.Data.OnDataChanged();
|
Isolines
The mesh surface series can display lines with specified elevation and stroke style (isolines). The following code shows how to display an isoline at some value:
| C# |
Copy Code
|
|
NSurfaceIsoline isoline = new NSurfaceIsoline();
isoline.Value = 10;
isoline.StrokeStyle = new NStrokeStyle(1, Color.Red);
meshSurface.Isolines.Add(isoline);
|
| Visual Basic |
Copy Code
|
|
Dim isoline As New NSurfaceIsoline
isoline.Value = 10
isoline.StrokeStyle = New NStrokeStyle(1, Color.Red)
meshSurface.Isolines.Add(isoline)
|
Formatting Commands
The mesh surface series supports two additional formatting commands for the tooltip texts.
<xvalue> - x-position value of a data point
<zvalue> - z-position value of a data point
The formatting of the x-position values is controlled by a NValueFormatter object accessible through the XValueFormatter property. The formatting of the z-position values is controlled by a NValueFormatter object accessible through the ZValueFormatter property.
Related Examples
Windows forms: Chart Gallery\Mesh Surface\...
Wpf: Chart Gallery\Mesh Surface\...
Web Forms: Chart Gallery\Mesh Surface\...
See Also