The first layout stage is called Initial Positioning. It can be enabled with the following code:
| C# |
Copy Code
|
|---|---|
NChart chart = nChartControl1.Charts[0];
chart.LabelLayout.EnableInitialPositioning = true;
|
|
| Visual Basic |
Copy Code
|
|---|---|
Dim chart as NChart = nChartControl1.Charts[0]; chart.LabelLayout.EnableInitialPositioning = True |
|
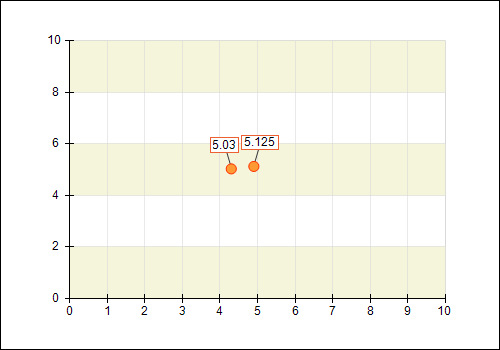
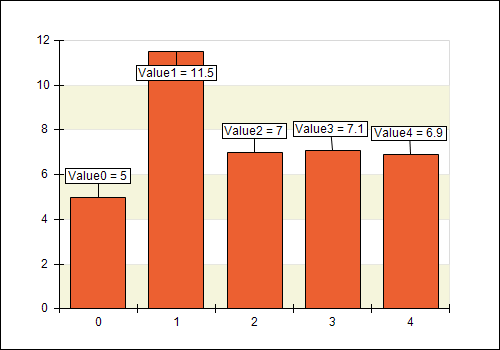
The purpose of Initial Positioning is to select a position for each label from a set of proposed locations situated around the origin point of the label. The control selects the location that causes minimum potential conflicts with other labels locations. The following images illustrate the effect of Initial Positioning on two overlapping data labels:
| Initial Positioning Disabled | Initial Positioning Enabled |
|---|---|
 |
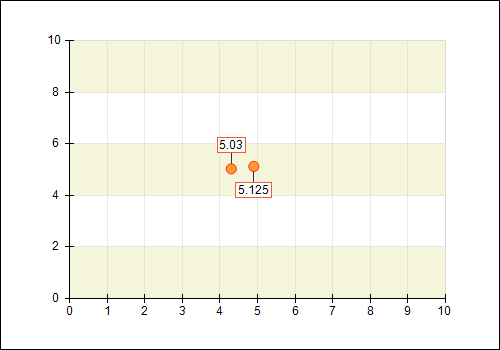 |
Up to eight location proposals can be specified separately for each series. For example in a chart with two series – line and bar, you can allow the line data labels to go in all eight directions (top, bottom, left, right, top-left, top-right, bottom-left, bottom-right) and at the same time the bar labels can be restricted to just “top” and “bottom” so that they appear either above or below the label origin point. The following code demonstrates how to set the label location proposals for a series:
| C# |
Copy Code
|
|---|---|
series.LabelLayout.LabelLocations = new LabelLocation[]
{
    LabelLocation.Top, LabelLocation.Bottom
};
|
|
| Visual Basic |
Copy Code
|
|---|---|
series.LabelLayout.LabelLocations = New LabelLocation() {LabelLocation.Top, LabelLocation.Bottom}
|
|
The order of the location proposals in the array determines their priority. The first proposed location has highest priority, which means that it will be selected unless it causes more conflicts than any of the following proposed locations.
The number of proposed locations determines the capability of the layout to avoid overlaps, but also affects the layout performance to some extent. By default all eight locations are enabled for each series, but you can reduce this number if the results are good enough with less proposed locations.
It is possible to disable the Initial Positioning on a per series basis. If you set the UseLabelLocations property to false, the position of each data label will be determined by the NDataLabelStyle object that is responsible for the label:
| C# |
Copy Code
|
|---|---|
series.LabelLayout.UseLabelLocations = false;
|
|
| Visual Basic |
Copy Code
|
|---|---|
series.LabelLayout.UseLabelLocations = False
|
|
The chart series provide settings for fine control over the proposed label locations that fall outside the plot area. The OutOfBoundsLocationMode property specifies how such “out-of-bounds” proposed locations should be treated. There are options to ignore them, use them with their original position, or shift them within the plot bounds. If all of the proposed locations are ignored the control can invert the locations automatically so that there is another chance for the label to be displayed. For example in case of a bar chart where labels are allowed to go only above the bars it is likely that the label of the highest bar will fall partially or fully outside the plot area bounds. If the InvertLocationsIfIgnored property is enabled, the proposed “top” location for this label will be inverted and the label will go downwards instead of upwards. The following images illustrate this scenario:
| InvertLocationsIfIgnored = false | InvertLocationsIfIgnored = true |
|---|---|
 |
 |
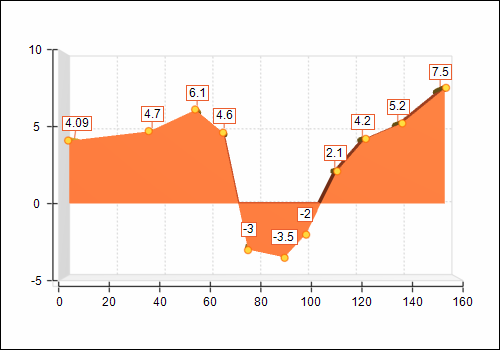
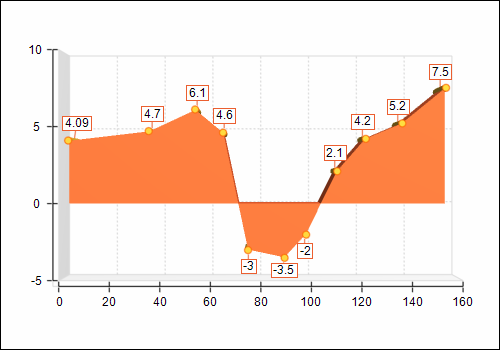
Another ability related to label locations is to invert the proposed locations for inverted data points. This is useful for charting types that display oriented data points like for example bar and area charts. The option is enabled through the InvertLocationsForInvertedDataPoints property. The following images illustrate the effect of this feature:
| InvertLocationsForInvertedDataPoints = false | InvertLocationsForInvertedDataPoints = true |
|---|---|
 |
 |
Naturally the Initial Positioning stage cannot avoid all label overlaps. It may happen that for some of the labels none of the proposed locations is applicable. You can instruct the chart to remove such labels for which the Initial Positioning stage has not been able to find an acceptable position. You can enable this option with the following code:
| C# |
Copy Code
|
|---|---|
chart.LabelLayout.RemoveOverlappedLabels = true;
|
|
| Visual Basic |
Copy Code
|
|---|---|
chart.LabelLayout.RemoveOverlappedLabels = True
|
|
If you prefer to keep all labels visible the second stage of the layout will try to handle the overlaps with a different approach.