Chart Data Model
In This Topic
Overview
The core of all charting software is the internal organization of data. In general there are two ways to organize the data in a chart:
Object based model.
In the object based model each data point is represented by an object with attributes such as coordinates, label, color etc.
Table model.
In the table model each data point is represented by a row in a table with several columns such as coordinates, label, color etc.
Data points are then grouped together in an object that represents how they are to be generally visualized (bar, line, pie etc.). This object is commonly called series.
The following table summarizes the advantages and disadvantages of each of the models:
| Data Model |
Advantages |
Disadvantages |
| Object Model |
- Adding or removing data points is easy
|
- Memory expensive when the number of data points increases
- Cannot efficiently represent data with many repeating values
- Inserting of large amounts of data is slow.
|
| Table Model |
- Fast access to individual data point properties.
- Can represent data with repeating values efficiently.
- Inserting of large amounts of data is fast.
|
- Adding or removing individual data points requires updating multiple columns of data.
|
Nevron Chart uses the table model, because it has more advantages compared to the object model. Since the object model is easier to work with Nevron Chart also provides an interface to support the common features of the object model. In other words the control internally uses solely the table model, but if you feel that it is more intuitive to work with the control as if it uses the object data model then you are free to do so.
Nevron Chart implements a slightly modified table model, which is specifically designed for the common usage of charting. In particular this is the difference between the column types – some data point attributes must always be present in order to have a valid data point, while for others this is not necessary and they use implied common values. This is because it is common to have charts with uniform appearance (for example if you want to display a series where all bars are green) in which case it is simply a duplication of effort and waste of memory to feed a color for each bar. The following table shows whether you must always specify a value for some of the commonly used column types:
| Column Type |
Description |
| Coordinate (X, Y, Z) |
Required |
| Label |
Required |
| Fill Style |
Not required |
| Border Style |
Not required |
| Data Label Style |
Not required |
Feeding Data
There are two ways to feed data to the chart – programmatically and trough data import.
Programmatically Feeding Data to Chart
This approach is useful when you have data, which is a result of computations performed in your program or if you want to have full control of how data is imported from a database. Let’s examine a simple case in which a XY scatter point chart with different fillings is created programmatically. The data required to create this chart is:
| Name |
Description |
| Y value |
The y value of the data point on the Y axis |
| X value |
The x value of the data point on the X axis |
| Filling |
The filling of the point (color, gradient, image etc.) |
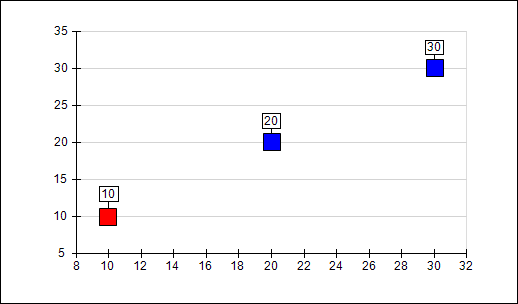
The following picture shows a simple XY scatter point chart with different fillings per data point:

The following code shows how to reproduce this chart using Nevron Chart API:
| C# |
Copy Code
|
NChart chart = nChartControl1.Charts[0];
NLegend legend = nChartControl1.Legends[0];
legend.Visible = false;
chart.BoundsMode = BoundsMode.Stretch;
// switch the axis in numeric mode
chart.Axis(StandardAxis.PrimaryX).ScaleConfigurator = new NLinearScaleConfigurator();
// create a point series
NPointSeries point = new NPointSeries();
chart.Series.Add(point);
point.UseXValues = true;
point.InflateMargins = true;
// add values using table interface
point.Values.Add(10);
point.XValues.Add(10);
point.FillStyles.Add(0, new NColorFillStyle(Color.Red));
point.Values.Add(20);
point.XValues.Add(20);
point.FillStyles.Add(1, new NColorFillStyle(Color.Green));
point.Values.Add(30);
point.XValues.Add(30);
point.FillStyles.Add(2, new NColorFillStyle(Color.Blue));
|
As you can see from the code above adding data is achieved in one of two ways, depending on whether the data is explicitly required. For explicitly required coordinates (X/Y) this is achieved by calling Add on the Values and XValues data columns and in the case of FillStyles (not explicitly required) this is achieved by calling Add with an index. If we want to plot only one of the points in different color then we can use the following code:
| C# |
Copy Code
|
point.FillStyle = new NColorFillStyle(Color.Blue);
// add values using table interface
point.Values.Add(10);
point.XValues.Add(10);
point.FillStyles.Add(0, new NColorFillStyle(Color.Red));
point.Values.Add(20);
point.XValues.Add(20);
point.Values.Add(30);
point.XValues.Add(30);
|
This will produce the following chart:
Note that for the second and third data point we didn’t explicitly specify a fill style and therefore these two data points are colored with the point series default filling which we set trough:
| C# |
Copy Code
|
| point.FillStyle = new NColorFillStyle(Color.Blue); |
This is the common way to work with data for all charting types, however it is well suited only for charts that contain relatively small amounts of data. This is because adding a coordinate takes a function call (Add). In order to feed data faster you must use the AddRange method exposed by each required column type – for example:
| C# |
Copy Code
|
double[] xValues = new double[] {10, 20, 30 };
double[] yValues = new double[] {10, 20, 30 };
point.FillStyle = new NColorFillStyle(Color.Blue);
point.FillStyles.Add(0, new NColorFillStyle(Color.Red));
// add values using table interface
point.Values.AddRange(yValues);
point.XValues.AddRange(xValues);
|
Now this code will not run much faster for three data points, however when the numbers increase the speed advantage is visible.
Finally adding data using the object model is achieved using the following code:
| C# |
Copy Code
|
NDataPoint dp1 = new NDataPoint(10, 10);
dp1[DataPointValue.FillStyle] = new NColorFillStyle(Color.Red);
point.AddDataPoint(dp1);
NDataPoint dp2 = new NDataPoint(20, 20);
dp2[DataPointValue.FillStyle] = new NColorFillStyle(Color.Green);
point.AddDataPoint(dp2);
NDataPoint dp3 = new NDataPoint(30, 30);
dp3[DataPointValue.FillStyle] = new NColorFillStyle(Color.Blue);
point.AddDataPoint(dp3);
|
Automatically Feeding Data
Nevron Chart has support for automatic data feed from one of the following data sources:
- objects that implement the IEnumerable inteface.
- DataTable and DataView.
- OleDbDataReader – supports direct reading of data from various data sourced supported by OleDB (SQL Server, Oracle etc.).
- CSV (comma separated values) – direct reading of CSV files from disk or memory.
- Excel – direct reading from XLS and XLSX files from disk or memory. Excel does not have to be present on the machine.
More information about automatic data feed is available under the Data Manipulation / Importing book in this documentation
Indexed Column Storage Types
All indexed columns (that is columns that store non mandatory information) support different storage types. The following table shows the supported storage types:
| Storage Type |
Speed |
Memory |
| Array |
Fastest access (constant access speed) |
Memory usage is proportional to the number of data points |
| Hash |
Fast access (constant access speed) |
Uses slightly more memory than necessary to hold the indexed data points |
| Sorted Array (default) |
Slower access (log(n) access speed) |
Uses only the memory necessary to hold the indexed data points |
The storage type is controlled from the storage type property of the series. The following example show how to switch the storage type to array:
| C# |
Copy Code
|
| someSeries.FillStyles.StorageType = IndexedStorageType.Array; |
For charts that require optimal performance it is recommended to use the Array storage type.
Related Examples
Nevron Chart \ Win Form \ Interactivity \ Mouse Events \ Hit Testing Scale Elements