Triangulated Surface
In This Topic
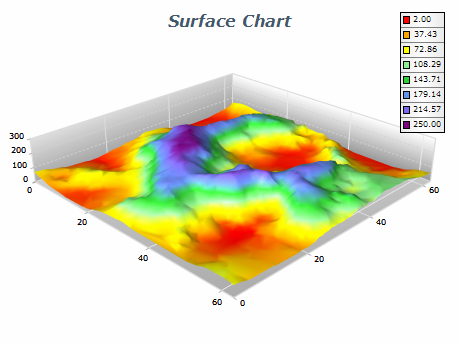
Triangulated Surface series can display a set of data points with custom X, Y, Z coordinates as a 3D surface. It is similar to the Mesh Surface series, the main difference being that the Triangulated Surface doesn't require the data points to be ordered in a grid. The control automatically creates a Delaunay triangular network in order to render the surface. The following image displays a Triangulated Surface chart:
Creating a Triangulated Surface
You have to create an instance of the NTriangulatedSurfaceSeries type and add it to the series collection of the chart. Surface series can be displayed only in 3D mode, so you have to enable 3D for the chart hosting the series:
| C# |
Copy Code
|
// obtain a reference to the Cartesian chart that is created by default
NChart chart = nChartControl1.Charts[0];

// switch in 3D
chart.Enable3D = true;

// set aspect 1:1:1
chart.Width = 50;
chart.Height = 50;
chart.Depth = 50;
// set projection
chart.Projection.SetPredefinedProjection(PredefinedProjection.PerspectiveTilted);

// create a surface series
NTriangulatedSurfaceSeries surface = new NTriangulatedSurfaceSeries();
// add the series to the chart series collection
chart.Series.Add(surface);
|
| Visual Basic |
Copy Code
|
' obtain a reference to the Cartesian chart that is created by default
Dim chart As NChart = NChartControl1.Charts(0)
' switch in 3D
chart.Enable3D = True
' set aspect 1:1:1
chart.Width = 50
chart.Height = 50
chart.Depth = 50
' set projection
chart.Projection.SetPredefinedProjection(PredefinedProjection.PerspectiveTilted)

' create a surface series
Dim surface As New NTriangulatedSurfaceSeries
' add the series to the chart series collection
chart.Series.Add(surface)
|
Passing Data
Once the Triangulated Surface series is created you can add some data in it. Triangulated Surface series use the Values data series for y (elevation) values, the XValues data series - for x position values and the ZValues data series for z (depth) position values. You should add at least three distinct points in order to display a surface.
| C# |
Copy Code
|
// point 1
triangulatedSurface.Data.AddValue(3.0, 5.0, 1.4);
// point 2
triangulatedSurface.Data.AddValue(2.0, 1.9, 5.1);
// point 3
triangulatedSurface.Data.AddValue(1, 3.5, 4.7);
|
| Visual Basic |
Copy Code
|
' point 1
triangulatedSurface.Data.AddValue(3.0, 5.0, 1.4)
' point 2
triangulatedSurface.Data.AddValue(2.0, 1.9, 5.1)
' point 3
triangulatedSurface.Data.AddValue(1, 3.5, 4.7)
|
Surface with Custom Colors
You can assign a custom color for each data point. To do so you must first add the data to the series, set the UseColor property to true, and specify the colors for each data point - for example:
| C# |
Copy Code
|
triangulatedSurface.Data.UseColors = true;
triangulatedSurface.Data.SetColor(0, Color.Red);
triangulatedSurface.Data.SetColor(1, Color.Green);
triangulatedSurface.Data.SetColor(2, Color.Blue);
|
| Visual Basic |
Copy Code
|
triangulatedSurface.Data.UseColors = True
triangulatedSurface.Data.SetColor(0, Color.Red)
triangulatedSurface.Data.SetColor(1, Color.Green)
triangulatedSurface.Data.SetColor(2, Color.Blue)
|
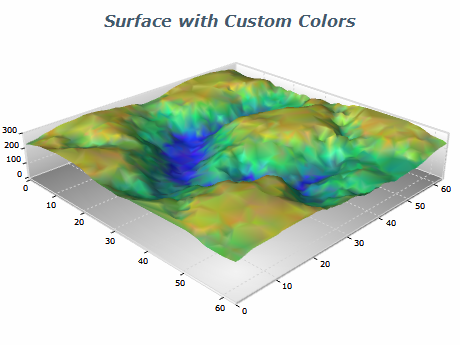
Custom colors can be used both for the surface filling and for the surface frame lines. To enable custom colors for the surface filling, you have to set the FillMode property to SurfaceFillMode.CustomColors. To enable custom colors for the surface frame lines, you have to set the FrameColorMode property to SurfaceFrameColorMode.CustomColors.
The following image displays a triangulated surface with custom colors:
Isolines
The triangulated surface series can display lines with specified elevation and stroke style (isolines). The following code shows how to display an isoline at some value:
| C# |
Copy Code
|
|
NSurfaceIsoline isoline = new NSurfaceIsoline();
isoline.Value = 10;
isoline.StrokeStyle = new NStrokeStyle(1, Color.Red);
triangulatedSurface.Isolines.Add(isoline);
|
| Visual Basic |
Copy Code
|
|
Dim isoline As New NSurfaceIsoline
isoline.Value = 10
isoline.StrokeStyle = New NStrokeStyle(1, Color.Red)
triangulatedSurface.Isolines.Add(isoline)
|
Related Examples
Windows forms: Chart Gallery\Mesh Surface\...
Wpf: Chart Gallery\Mesh Surface\...
Web Forms: Chart Gallery\Mesh Surface\...
See Also