Graphics Path
In This Topic
A Graphics Path chart displays an arbitrary figure defined by lines and bezier segments. The following figure shows several graphics path series inside a chart that are used to draw figures at different scale coordinates:
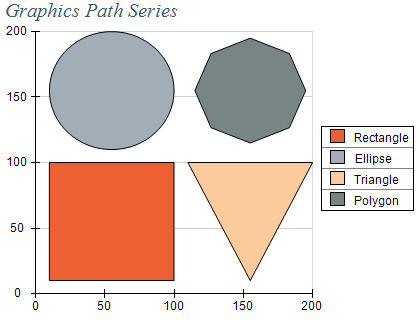
Figure 1.
Creating a Polar Range series
Graphics Path series are represented by the NGraphicsPathSeries type. An instance of this type must be added to the series collection of a Cartesian Chart).
| C# |
Copy Code
|
NChart chart = nChartControl1.Charts[0];
NGraphicsPathSeries graphicsPathSeries = new NGraphicsPathSeries();
chart.Series.Add(graphicsPathSeries);
|
| Visual Basic |
Copy Code
|
Dim chart As NChart = NChartControl1.Charts(0)
Dim graphicsPathSeries As New NGraphicsPathSeries()
chart.Series.Add(graphicsPathSeries)
|
Passing Data
Once the series is created you can add some data in it. The shape represented by the graphics path is contained inside a NGraphicsPath object exposed from the GraphicsPath property of the series. The following code snippets show how to draw different shapes using this series:
| C# |
Copy Code
|
|
// draw rectangle
NGraphicsPathSeries rectangleSeries = new NGraphicsPathSeries();
NGraphicsPath rectanglePath = new NGraphicsPath();
rectanglePath.AddRectangle(0, 0, 1, 1);
rectangleSeries.GraphicsPath = rectanglePath;
chart.Series.Add(rectangleSeries);
// draw ellipse
NGraphicsPathSeries ellipseSeries = new NGraphicsPathSeries();
NGraphicsPath ellipsePath = new NGraphicsPath();
ellipsePath.AddEllipse(0, 0, 1, 1);
ellipseSeries.GraphicsPath = ellipsePath;
chart.Series.Add(ellipseSeries);
// draw triangle
NGraphicsPathSeries triangleSeries = new NGraphicsPathSeries();
NGraphicsPath trianglePath = new NGraphicsPath();
trianglePath.StartFigure(0.0, 0.0);
trianglePath.LineTo(0.5, 1.0);
trianglePath.LineTo(1.0, 0.0);
trianglePath.CloseFigure();
triangleSeries.GraphicsPath = trianglePath;
chart.Series.Add(triangleSeries);
|
| Visual Basic |
Copy Code
|
|
' draw rectangle
Dim rectangleSeries As New NGraphicsPathSeries()
Dim rectanglePath As New NGraphicsPath()
rectanglePath.AddRectangle(0, 0, 1, 1)
rectangleSeries.GraphicsPath = rectanglePath
chart.Series.Add(rectangleSeries)
' draw ellipse
Dim ellipseSeries As New NGraphicsPathSeries
Dim ellipsePath As New NGraphicsPath()
ellipsePath.AddEllipse(0, 0, 1, 1)
ellipseSeries.GraphicsPath = ellipsePath
chart.Series.Add(ellipseSeries)
' draw triangle
Dim triangleSeries As New NGraphicsPathSeries()
Dim trianglePath As New NGraphicsPath()
trianglePath.StartFigure(0.0, 0.0)
trianglePath.LineTo(0.5, 1.0)
trianglePath.LineTo(1.0, 0.0)
trianglePath.CloseFigure()
triangleSeries.GraphicsPath = trianglePath
chart.Series.Add(triangleSeries)
|
Related Examples
Windows forms: Chart Gallery\Graphics Path\Graphics Path