Vertex Surface
In This Topic
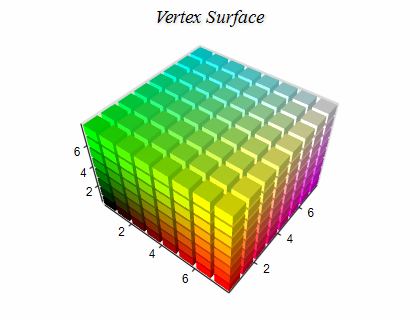
Vertex Surface series can display arbitrary shapes and lines in 3D. With this surface type, you can specify the positions of each vertex as well as how the vertices are connected to form the surface mesh.
Creating a Vertex Surface
You have to create an instance of the NVertexSurfaceSeries type and add it to the series collection of the chart. Vertex surface series can be displayed only in 3D mode, so you have to enable 3D for the chart hosting the series:
| C# |
Copy Code
|
// obtain a reference to the Cartesian chart that is created by default
NChart chart = nChartControl1.Charts[0];

// switch in 3D
chart.Enable3D = true;

// set aspect 1:1:1
chart.Width = 50;
chart.Height = 50;
chart.Depth = 50;
// set projection
chart.Projection.SetPredefinedProjection(PredefinedProjection.PerspectiveTilted);

// create a surface series
NVertexSurfaceSeries surface = new NVertexSurfaceSeries();
// add the series to the chart series collection
chart.Series.Add(surface);
|
| Visual Basic |
Copy Code
|
' obtain a reference to the Cartesian chart that is created by default
Dim chart As NChart = NChartControl1.Charts(0)
' switch in 3D
chart.Enable3D = True
' set aspect 1:1:1
chart.Width = 50
chart.Height = 50
chart.Depth = 50
' set projection
chart.Projection.SetPredefinedProjection(PredefinedProjection.PerspectiveTilted)

' create a surface series
Dim surface As New NVertexSurfaceSeries
' add the series to the chart series collection
chart.Series.Add(surface)
|
Passing Data
Once the Vertex Surface series is created you need to specify the vertex surface primitive and add some data to it. To specify the vertex surface primitive you use the VertexPrimitive property of the surface, which accepts values from the VertexPrimitive enum:
| C# |
Copy Code
|
surface.VertexPrimitive = VertexPrimitive.Triangles;
|
| Visual Basic |
Copy Code
|
surface.VertexPrimitive = VertexPrimitive.Triangles
|
The following table describes the values of this enum:
| Vertex Primitive |
Description |
Image |
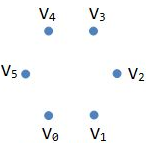
| Points |
Each vertex in the Data series is rendered as a point. |
 |
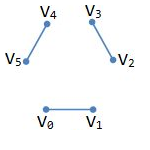
| Lines |
Each pair of vertices in the Data series is rendered as a separate line segment. |
 |
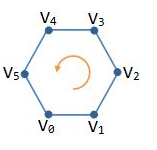
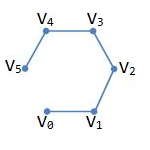
| LineLoop |
The vertices in the Data series are rendered as a closed line. |
 |
| LineStrip |
The vertices in the Data series are rendered as a line. |
 |
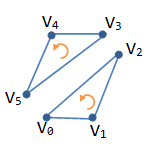
| Triangles |
Each group of three consecutive vertices in the Data series is rendered as a triangle. For example vertices n, n + 1 and n+ 2 form a triangle, n + 3, n + 4, and n + 5 form a triangle and so on. |
 |
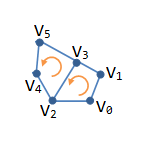
| TriangleStrip |
Each tree adjacent points in the Data series form a triangle. For example n, n + 1 and n+ 2 form a triangle, n + 1, n + 2 and n + 3 form a triangle, and so on. |
 |
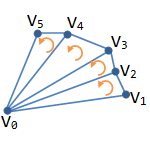
| TriangleFan |
The first vertex participates in all triangles. Then every pair of adjacent vertices forms a triangle with the first vertex. For example 0, n, and n + 1 form a triangle, 0, n + 2, and n + 3 form a triangle and so on. |
 |
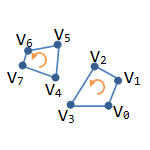
| Quads |
Each group of four consecutive vertices in the Data series is rendered as a quad. For example n, n + 1, n + 2, and n + 3 form a quad, n + 4, n + 5, n + 6, and n + 7 form a quad and so on. |
 |
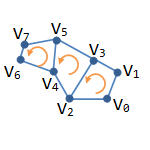
| QuadStrip |
Each pair of vertices forms a quad with the next pair. For example n, n + 1, n + 2, and n + 3 form a quad, n + 2, n + 3, n + 4, and n + 5 form a quad and so on. |
 |
Vertex Surface series accept vertex data from the Data series attached to the surface. The following code adds three points to a vertex surface series.
| C# |
Copy Code
|
// point 1
surface.Data.AddValue(3.0, 5.0, 1.4);
// point 2
surface.Data.AddValue(2.0, 1.9, 5.1);
// point 3
surface.Data.AddValue(1, 3.5, 4.7);
|
| Visual Basic |
Copy Code
|
' point 1
surface.Data.AddValue(3.0, 5.0, 1.4)
' point 2
surface.Data.AddValue(2.0, 1.9, 5.1)
' point 3
surface.Data.AddValue(1, 3.5, 4.7)
|
Provided that you set the vertex primitive of the surface to triangle this code will render a triangle in 3D.
Surface with Custom Colors
You can assign a custom color for each data point. To do so you must first add the data to the series, set the UseColor property to true, and specify the colors for each data point - for example:
| C# |
Copy Code
|
VertexSurface.Data.UseColors = true;
VertexSurface.Data.SetColor(0, Color.Red);
VertexSurface.Data.SetColor(1, Color.Green);
VertexSurface.Data.SetColor(2, Color.Blue);
|
| Visual Basic |
Copy Code
|
VertexSurface.Data.UseColors = True
VertexSurface.Data.SetColor(0, Color.Red)
VertexSurface.Data.SetColor(1, Color.Green)
VertexSurface.Data.SetColor(2, Color.Blue)
|
Custom colors can be used both for the surface filling and for the surface frame lines. To enable custom colors for the surface filling, you have to set the FillMode property to SurfaceFillMode.CustomColors. To enable custom colors for the surface frame lines, you have to set the FrameColorMode property to SurfaceFrameColorMode.CustomColors.
Isolines
The Vertex surface series can display lines with specified elevation and stroke style (isolines). The following code shows how to display an isoline at some value:
| C# |
Copy Code
|
|
NSurfaceIsoline isoline = new NSurfaceIsoline();
isoline.Value = 10;
isoline.StrokeStyle = new NStrokeStyle(1, Color.Red);
VertexSurface.Isolines.Add(isoline);
|
| Visual Basic |
Copy Code
|
|
Dim isoline As New NSurfaceIsoline
isoline.Value = 10
isoline.StrokeStyle = New NStrokeStyle(1, Color.Red)
VertexSurface.Isolines.Add(isoline)
|
Related Examples
Windows forms: Chart Gallery\Vertex Surface\...
Wpf: Chart Gallery\Vertex Surface\...
WebForms: Chart Gallery\Vertex Surface\...
See Also