Pie
In This Topic
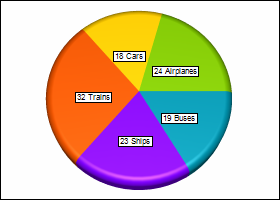
A Pie Chart is a circular chart divided into sectors, where the arc length of each sector is proportional to the quantity it represents. Pie Charts are convenient when you need to compare the value for a given category with the total. The following figure displays a pie chart.
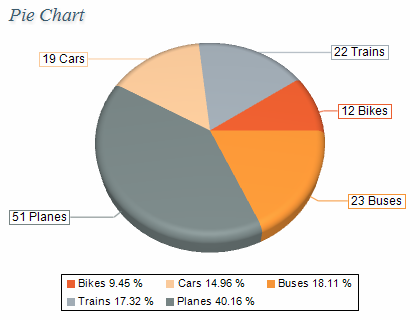
Figure 1.
Creating a pie series
Pie series are represented by the NPieSeries type. An instance of this type must be added to the series collection of a Pie Chart (NPieChart object).
| C# |
Copy Code
|
// clear the Charts collection and create a new pie chart
NPieChart chart = new NPieChart();
chartControl.Charts.Clear();
chartControl.Charts.Add(chart);

// add a pie series to the pie chart
NPieSeries pie = (NPieSeries)chart.Series.Add(SeriesType.Pie);
|
| Visual Basic |
Copy Code
|
' clear the Charts collection and create a new pie chart
Dim chart As New NPieChart
chartControl.Charts.Clear()
chartControl.Charts.Add(chart)

' add a pie series to the pie chart
Dim pie As NPieSeries = chart.Series.Add(SeriesType.Pie)
|
Passing Data
Once the pie series is created you can add some data in it. Pie series use the Values data series of its base class for the pie values. In addition to this data series the pie series provides another data series of type Double, which holds the pie segments detachments from the pie center. It is accessible through the Detachments property of the NPieSeries object.
You can either manipulate directly the Values and Detachments data series, or use the data point interface to add data. The NPieDataPoint class provides several constructors that can be very helpful when you add data points. Please refer to the Working with Data Points topic for more information.
Controlling the pie shape
The shape of the pie segments can be controlled through the PieStyle property. It accepts values from the PieStyle enumeration. For example the following code will display a smooth edge pie chart:
| C# |
Copy Code
|
pie.PieStyle = PieStyle.SmoothEdgePie;
|
| Visual Basic |
Copy Code
|
pie.PieStyle = PieStyle.SmoothEdgePie
|
The depth of 3D pies is controlled trough the Depth property of the NChart object in which the pie series was created. The following code will change the depth of the pie segments:
| C# |
Copy Code
|
chart.Depth = 30;
|
| Visual Basic |
Copy Code
|
chart.Depth = 30
|
When the pies are visualized as smooth edge pies you can control the size of the smoothed edge with the help of the PieEdgePercent property. It specifies the edge size in percent of the smaller pie dimension (depth or radius). By default it is set to 25. The following code will increase the size of the pie edge:
| C# |
Copy Code
|
pie.PieEdgePercent = 35;
|
| Visual Basic |
Copy Code
|
pie.PieEdgePercent = 35
|
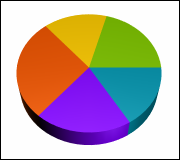
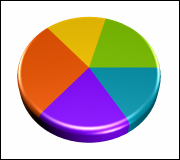
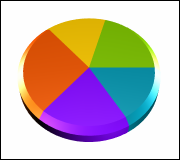
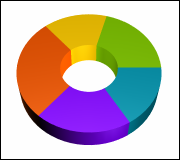
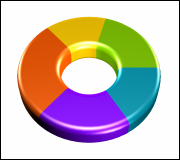
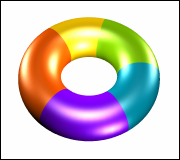
| Demonstration of different pie segment shapes |
| Pie |
Smooth Edge Pie |
Cut Edge Pie |
 |
 |
 |
| Ring |
Smooth Edge Ring |
Cut Edge Ring |
 |
 |
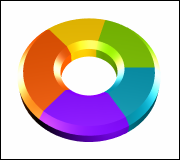 |
| Torus |
|
|
 |
|
|
Controlling the data labels
The pie chart data labels can be displayed in several modes. The LabelMode property of the NPieSeries object controls the pie labels mode. It is of type PieLabelMode and accepts the following values:
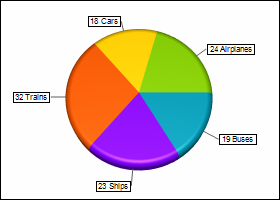
Center - the data labels are displayed in the center of the pie segments.
Rim - the data labels are visualized at the pies rim.
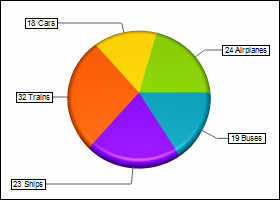
Spider - the data labels are visualized at aligned in columns on the left and right side of the pie.
SpiderNoOverlap - similar to the Spider mode, but the data labels are automatically positioned to avoid overlaps and to stay within the bounds of the chart panel. In this mode the labels can be scaled down if necessary.
The following table demonstrates the different label modes.
| Demonstration of different pie label modes |
| Center |
Rim |
 |
 |
| Spider |
SpiderNoOverlap |
 |
 |
By default the
LabelMode property is set to
Rim. The following code will display the data labels in
Spider mode:
| C# |
Copy Code
|
pie.LabelMode = PieLabelMode.Spider;
|
| Visual Basic |
Copy Code
|
pie.LabelMode = PieLabelMode.Spider
|
In SpiderNoOverlap mode the lines that connect pie sectors with their data labels consist of several parts. You can use the LeadOffArrowLength and ConnectorLength properties to control the length of the label connectors.
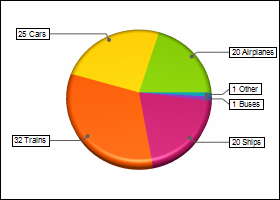
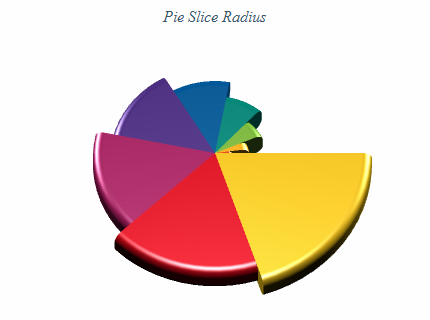
Controlling the pie slice radius
The pie series has a feature that allows you to specify the begin / end percent width of each individual pie slice inside a pie series. This allows you have pie slices which have different radius that the rest of the slices in the pie and is commonly used if you want to visually emphasize the importance of a pie slice relative to the other slices. This is achived by enabled the begin / end width percents of the series and adding the respective begin / end percents to the pie series. The following code shows how to create a pie series where the third pie has a different radius:
| C# |
Copy Code
|
nChartControl1.Panels.Clear();
NPieChart pieChart = new NPieChart();
pieChart.InnerRadius = new NLength(0);
nChartControl1.Panels.Add(pieChart);
NPieSeries pieSeries = new NPieSeries();
pieSeries.UseBeginEndWidthPercents = true;
pieChart.Series.Add(pieSeries);
pieSeries.Values.Add(10);
pieSeries.BeginWidthPercents.Add(0);
pieSeries.EndWidthPercents.Add(70);
pieSeries.Values.Add(10);
pieSeries.BeginWidthPercents.Add(0);
pieSeries.EndWidthPercents.Add(70);
pieSeries.Values.Add(20);
pieSeries.BeginWidthPercents.Add(0);
pieSeries.EndWidthPercents.Add(100);
|
| Visual Basic |
Copy Code
|
NChartControl1.Panels.Clear()
Dim pieChart As New NPieChart
pieChart.InnerRadius = New NLength(0)
NChartControl1.Panels.Add(pieChart)
Dim pieSeries As New NPieSeries
pieSeries.UseBeginEndWidthPercents = True
pieChart.Series.Add(pieSeries)
pieSeries.Values.Add(10)
pieSeries.BeginWidthPercents.Add(0)
pieSeries.EndWidthPercents.Add(70)
pieSeries.Values.Add(10)
pieSeries.BeginWidthPercents.Add(0)
pieSeries.EndWidthPercents.Add(70)
pieSeries.Values.Add(20)
pieSeries.BeginWidthPercents.Add(0)
pieSeries.EndWidthPercents.Add(100)
|
Miscellaneous
The BeginAngle property specifies the initial rotation of the first item. The TotalAngle property controls the total angle (in degrees) in which pies are displayed. By default this property is 360 degrees. The following code will change the begin angle of the pies to 30 degrees and set the total angle to 180 degrees.
| C# |
Copy Code
|
pie.BeginAngle = 30;
pie.TotalAngle = 180;
|
| Visual Basic |
Copy Code
|
pie.BeginAngle = 30
pie.TotalAngle = 180
|
Figure 2 shows a half pie (180 degrees) with begin angle set to 30 degrees.
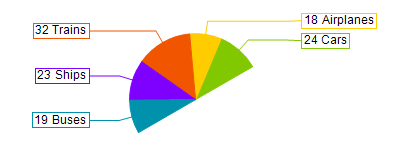
figure 2
The BeginWidthPercent and EndWidthPercent properties control the pie segment begin and end width in terms of percents of the pie series total length. The following image shows a pie chart with modified pie begin / end width percents:
Formatting Commands
The NPieSeries class extends the formatting commands set inherited from the NSeries base class with the following formatting commands:
<detachment> - the current data point pie detachment value (extracted from the Detachments data series)
Related Examples
Windows forms: Chart Gallery\Pie\
Wpf: Chart Gallery\Pie\
ASP.NET: Chart Gallery\Pie\
See Also