High-Low
In This Topic
A High-Low Chart displays a sequence of data points, each representing a one-dimensional value range. The begin values of consecutive data points are connected with a "low" line. The end values are connected with a "high" line. The area between these two lines is filled with different colors, depending on whether the "high" line runs above or below the "low" line. The following images display high-low charts.
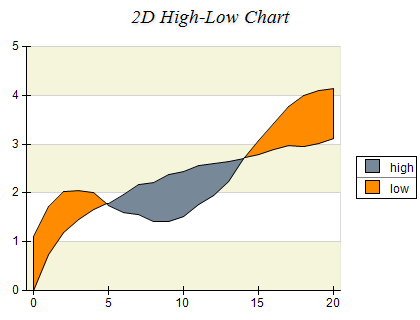
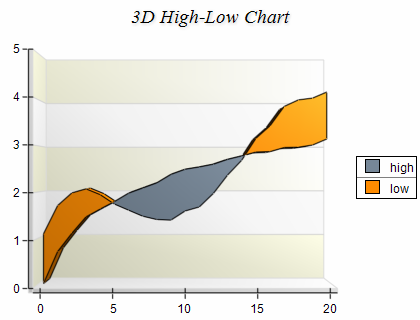
Figure 1.
Creating a High Low series
High-Low serires are represented by the NHighLowSeries type. An instance of this type must be added to the series collection of a Cartesian chart.
| C# |
Copy Code
|
// obtain a reference to the Cartesian chart that is created by default
NCartesianChart chart = (NCartesianChart)chartControl.Charts[0];

// add a HighLow series to it
NHighLowSeries hilow = (NHighLowSeries)chart.Series.Add(SeriesType.HighLow);
|
| Visual Basic |
Copy Code
|
' obtain a reference to the Cartesian chart that is created by default
Dim chart As NCartesianChart = chartControl.Charts(0)

' add a HighLow series to it
Dim hilow As NHighLowSeries = chart.Series.Add(SeriesType.HighLow)
|
Passing Data
Once the highlow series is created you can add some data in it. HighLow series use the Values data series for the high values and the XValues data series for the custom x positions of the data points.
In addition to these data series the High-Low series provides another data series of type Double, which holds the low values. It is accessible through the LowValues property of NHighLowSeries object. For consistency the Values data series can also be accesses through the HighValues property of the NHighLowSeries object.
You can either manipulate directly the HighValues, LowValues and XValues data series, or use the data point interface to add data. The NHighLowDataPoint class provides several constructors that can be very helpful when you add data points. Please refer to the Working with Data Points topic for more information.
Controlling the high low area depth
The depth of the high low area is specified in percents of the grid cell depth it occupies. The DepthPercent property controls this percentage. By default it is set to 50. The following code will increase the area depth to 70 precent:
| C# |
Copy Code
|
hilow.DepthPercent = 70;
|
| Visual Basic |
Copy Code
|
hilow.DepthPercent = 70.
|
Drop Lines
Drop lines are lines separating the high low area segments. You can control their visibility with the help of the DropLines property. By default it is set to false. The following code will display the drop lines:
| C# |
Copy Code
|
hilow.DropLines = true;
|
| Visual Basic |
Copy Code
|
hilow.DropLines = True
|
Controlling the appearance of the high low series
The high-low series supports two appearance modes - the first one (SeriesAppearanceMode.Generic) is the generic series appearance mode as it is described in the One Value Series Functionality topic; the second appearance mode (SeriesAppearanceMode.SeriesLogic) is specific for the high-low series. In this mode the appearance styles are applied according to the following rules: the areas, where the high values are greater than the low values, are displayed with the HighFillStyle and HighBorderStyle styles. The areas, where the high values are smaller than the low values, are displayed with the LowFillStyle and LowBorderStyle styles.
The High-Low series appearance mode is controlled through the AppearanceMode property. By default it is set to SeriesLogic. The following code example sets red color for the high areas and blue color for the low areas:
| C# |
Copy Code
|
hilow.HighFillStyle = new NColorFillStyle(Color.Red);
hilow.LowFillStyle = new NColorFillStyle(Color.Blue);
|
| Visual Basic |
Copy Code
|
hilow.HighFillStyle = New NColorFillStyle(Color.Red)
hilow.LowFillStyle = New NColorFillStyle(Color.Blue)
|
Formatting commands
The NHighLowSeries class extends the formatting commands set inherited from its base class with the following formatting commands:
<high_value> - the current data point high value (extracted from the HighValues data series)
<low_value> - the current data point low value (extracted from the LowValuesdata series)
<high_label> - replaced with the HighLabel string if the data point is with up orientation or with empty string if not
<low_label> - replaced with the LowLabel string if the data point is with down orientation or with empty string if not
Labeling high and low area segments
In some cases it is required to apply common labels to the "high" and "low" segments of the High-Low series. The label text applied to "high" area segments is specified with the help of the HighLabel property. Alternatively the label text for the "low" segments is specified by the LowLabel property. You can easily display these labels in the legend and the data points. The following code demonstrates this:
| C# |
Copy Code
|
// specify the texts
hilow.HighLabel = "up";
hilow.LowLabel = "down";

// set the formatting commands
hilow.DataLabelStyle.Format = "<high_label><low_label>";

// configure the legend
hilow.Legend.Mode = SeriesLegendMode.SeriesLogic;
|
| Visual Basic |
Copy Code
|
' specify the texts
hilow.HighLabel = "up"
hilow.LowLabel = "down"

' set the formatting commands
hilow.DataLabelStyle.Format = "<high_label><low_label>"

' configure the legend
hilow.Legend.Mode = SeriesLegendMode.SeriesLogic
|
Please note that the formatting commands are without space between them. This is because the component renders only one of the label strings. If there was a space between the format commands the string for high areas would have an extra trailing space, while the string for low labels would have an extra leading space.
Palette
The area series can have an associated palette, in which case the Fill properties of the series / data points are discarded. The following code snippet shows how to apply a palette filling:
| C# |
Copy Code
|
|
NPalette palette = new NPalette();
palette.Clear();
palette.Add(0, Color.Green);
palette.Add(60, Color.Yellow);
palette.Add(120, Color.Red);
highLowSeries.Palette = palette;
|
| Visual Basic |
Copy Code
|
|
Dim palette As New NPalette
palette.Clear()
palette.Add(0, Color.Green)
palette.Add(60, Color.Yellow)
palette.Add(120, Color.Red)
highLowSeries.Palette = palette
|
Related Examples
Windows forms: Chart Gallery\High Low\Standard High Low
Windows forms: Chart Gallery\High Low\Advanced High Low
See Also