Point and Figure
In This Topic
Point and Figure charts display series of columns that are made up of 'X' or 'O' signs. A column of X's represents an uptrend, while a column of O's represents a downtrend. The charts ignore the time factor and focus on price movements. Point and Figure charts are used to identify support levels, resistance levels and chart patterns. The following figure displays a Point and Figure chart.
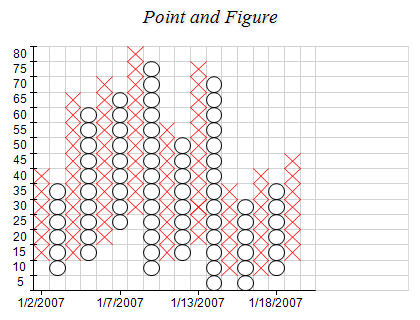
Figure 1.
Creating a Point and Figure series
To display a Point and Figure chart you have to create an instance of the NPointAndFigureSeries type and add it to the series collection of a Cartesian chart.
Point and Figure series can be displayed only in 2D mode only.
| C# |
Copy Code
|
// obtain a reference to the Cartesian chart that is created by default
NChart chart = chartControl.Charts[0];

// create a Point and Figure series
NPointAndFigureSeries series = new NPointAndFigureSeries();

// add the series to the chart series collection
chart.Series.Add(series);
|
| Visual Basic |
Copy Code
|
' obtain a reference to the Cartesian chart that is created by default
Dim chart As NChart = chartControl.Charts(0)

' create a Point and Figure series
Dim series As New NPointAndFigureSeries

' add the series to the chart series collection
chart.Series.Add(series)
|
Passing Data
Once the Point and Figure series is created you can add some data in it. Point and Figure series use the Values data series for price values and the XValues data series for date-time values associated with the prices. The date-time values are used only for annotation of the X axis and do not influence the actual X positions of the data points.
Please note, that Point and Figure chart transforms the data before displaying it and there is no direct correspondence between values and displayed data points.
Configuring the X Axis Scale
The X axis can be set to display date-time labels with the help of a special scale configurator. You have to assign an instance of the
NPriceScaleConfigurator type to the
ScaleConfigurator property of the X axis. The date-time values must be filled in the
XValues data series of the Point and Figure series and the
UseXValues property must be set to true. The scale configurator will automatically extract the date-time information for the axis labels from the Point and Figure series.
Point and Figure Options
The "sensitivity" of a Point and Figure chart can be adjusted by altering the BoxSize property. The box size is the minimum price movement recorded and serves to filter minor price changes. Larger box sizes are used for charting longer time periods.
A price needs to reverse with the size of one or several boxes in order for a new column to be formed. The exact number of boxes needed for a reversal can be specified with the ReversalAmount property.
Related Examples
Chart Gallery\Point and Figure\...
See Also