Bubble
In This Topic
Bubble Charts are a convenient way for graphical representation of multi-dimensional data. The data points are displayed as circles (or other shapes) with variable parameters (size, position etc.) that depend on the input data. For example a 2D Bubble Chart can represent a data set with up to 4 dimensions: X position, Y position, Size and Color. The following pictures show 2D and 3D bubble charts:
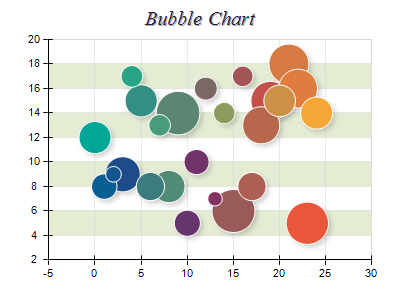
Figure 1.
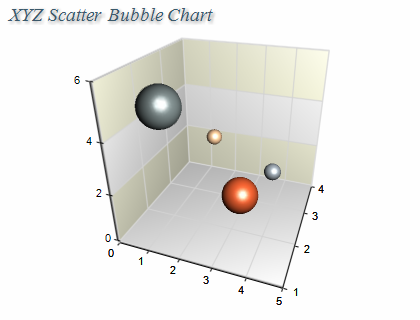
Figure 2.
Creating a bubble series
Bubble series are represented by the NBubbleSeries type. An instance of this type must be added to the series collection of a Cartesian chart.
| C# |
Copy Code
|
// obtain a reference to the Cartesian chart that is created by default
NCartesianChart chart = (NCartesianChart)chartControl.Charts[0];

// add a bubble series to it
NBubbleSeries bubble = (NBubbleSeries)chart.Series.Add(SeriesType.Bubble);
|
| Visual Basic |
Copy Code
|
' obtain a reference to the Cartesian chart that is created by default
Dim chart As NCartesianChart = chartControl.Charts(0)

' add a bubble series to it
Dim bubble As NBubbleSeries = chart.Series.Add(SeriesType.Bubble)
|
Passing Data
Once the bubble series is created you can add some data in it. Bubble series use the Values data series for the Y positions, the XValues data series for the X positions, the ZValues data series for Z positions.
In addition to these data series the bubble series provides another data series of type Double, which holds the bubble sizes. It is accessible through the Sizes property of NBubbleSeries object.
You can either manipulate directly these data series, or use the data point interface to supply data to the bubble series. The NBubbleDataPoint class provides several constructors that can be very helpful when you add bubble data points. Please refer to the Working with Data Points topic for more information.
Controlling the shape of the bubbles
The shape of the bubbles can be controlled through the BubbleShape property. It accepts values from the PointShape enumeration. For example the following code will display the bubbles as spheres:
| C# |
Copy Code
|
bubble.BubbleShape = PointShape.Sphere;
|
| Visual Basic |
Copy Code
|
bubble.BubbleShape = PointShape.Sphere
|
Controlling the bubble sizes
You can specify the display sizes of the smallest and the largest bubbles through the MinSize and MaxSize properties. They are by default set to 2.5f and 12.5f Model units respectively. The following code will increase the size of all bubbles with 1 Model unit:
| C# |
Copy Code
|
bubble.MinSize = 3.5f;
bubble.MaxSize = 13.5f;
|
| Visual Basic |
Copy Code
|
bubble.MinSize = 3.5F
bubble.MaxSize = 13.5F
|
Formatting Commands
The NBubbleSeries class extends the formatting commands set inherited from the NXYZScatterSeries class with the following formatting commands:
<size> - the current data point bubble size (obtained from the Sizes data series)
The following code will display the bubble sizes in the legend
| C# |
Copy Code
|
bubble.Legend.Mode = SeriesLegendMode.DataPoints;
bubble.Legend.Format = "<size>";
|
| Visual Basic |
Copy Code
|
bubble.Legend.Mode = SeriesLegendMode.DataPoints
bubble.Legend.Format = "<size>"
|
Palette
The bubble series can have an associated palette, in which case the Fill properties of the series / data points are discarded. The following code snippet shows how to apply a palette filling:
| C# |
Copy Code
|
|
NPalette palette = new NPalette();
palette.Clear();
palette.Add(0, Color.Green);
palette.Add(60, Color.Yellow);
palette.Add(120, Color.Red);
bubbleSeries.Palette = palette;
|
| Visual Basic |
Copy Code
|
|
Dim palette As New NPalette
palette.Clear()
palette.Add(0, Color.Green)
palette.Add(60, Color.Yellow)
palette.Add(120, Color.Red)
bubbleSeries.Palette = palette
|
Size Scale
The bubble series has a special legend display mode in which it can display a size scale on the legend. This feature allows the user to have a visual representation of the bubble sizes. The following code shows how to enable this feature:
| C# |
Copy Code
|
|
bubbleSeries.Legend.Mode = SeriesLegendMode.SeriesLogic;
bubbleSeries.BubbleSizeScale.TextOffset = new NLength(0);
bubbleSeries.BubbleSizeScale.TextStyle.StringFormatStyle.HorzAlign = HorzAlign.Center;
bubbleSeries.BubbleSizeScale.Mode = BubbleSizeScaleMode.ConcentricDown;
|
| Visual Basic |
Copy Code
|
|
bubbleSeries.Legend.Mode = SeriesLegendMode.SeriesLogic
bubbleSeries.BubbleSizeScale.TextOffset = New NLength(0)
bubbleSeries.BubbleSizeScale.TextStyle.StringFormatStyle.HorzAlign = HorzAlign.Center
bubbleSeries.BubbleSizeScale.Mode = BubbleSizeScaleMode.ConcentricDown
|
Z Order Considerations
The Ellipse, Cross, DiagonalCross and Star styles display bubbles that do not have depth dimension when displayed in 3D. This makes possible for Nevron Chart to apply Z order on them so that the bigger bubbles never overlap the smaller ones. If your 3D bubble chart is likely to have overlapped bubbles it is recommended to use these bubble styles.
Related Examples
Windows forms: Chart Gallery\Bubble
Wpf: Chart Gallery\Bubble\
ASP.NET: Chart Gallery\Bubble\
See Also