Constant Lines
In This Topic
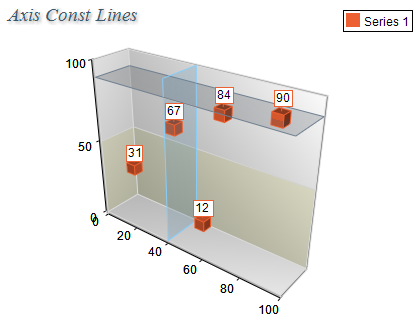
Axis constant (reference) lines are primary used when you want to visually emphasize that some axis value is important for the data displayed by the chart. The following image shows a 3D chart with two constant lines - one attached to the X axis and one attached to the Y Axis:
Each constant line is represented by an instance of the
NAxisConstLine object. The constant lines are contained in a collection of type
NAxisConstLineCollection, which is accessible through the
ConstLines property of the
NAxis class. The following code obtains a reference to the constant lines collection of the PrimaryY axis:
| C# |
Copy Code
|
NCartesianChart chart = (NCartesianChart)chartControl.Charts[0];
NAxisConstLineCollection constLines = chart.Axis(StandardAxis.PrimaryY).ConstLines;
|
| Visual Basic |
Copy Code
|
Dim chart As NCartesianChart = CType(NChartControl1.Charts(0), NCartesianChart)
Dim constLines As NAxisConstLineCollection = chart.Axis(StandardAxis.PrimaryY).ConstLines
|
Creating a new constant line
You create a constant line by creating an instance of the NAxisConstLine class. The following code will add a constant line to the PrimaryY axis of the first chart in the control:
| C# |
Copy Code
|
NCartesianChart chart = (NCartesianChart)NChartControl1.Charts[0];
NAxis axis = (NAxis)chart.Axis(StandardAxis.PrimaryY);
NAxisConstLine constLine = new NAxisConstLine();
axis.ConstLines.Add(constLine);
|
| Visual Basic |
Copy Code
|
Dim chart As NCartesianChart = CType(NChartControl1.Charts(0), NCartesianChart)
Dim axis As NAxis = chart.Axis(StandardAxis.PrimaryY)
Dim constLine As New NAxisConstLine
axis.ConstLines.Add(constLine)
|
After you create the constant line you can modify its Value property which associates the constant line with a specific axis value. The following code will display the newly created line on value 20 of the PrimaryY axis:
| C# |
Copy Code
|
constLine.Value = 20;
|
| Visual Basic |
Copy Code
|
constLine.Value = 20
|
You can also instruct the const line to include the value in the range of the axis the const line is attached to. This is done with the IncludeInAxisRange property:
| C# |
Copy Code
|
|
constLine.IncludeInAxisRange = true;
|
| Visual Basic |
Copy Code
|
| constLine.IncludeInAxisRange = True |
Controlling the constant line style
Constant lines can be displayed as simple lines or as planes. The style of the constant line is controlled through the Style property of the NAxisConstLine class. It accepts the values of the ConstLineStyle enumeration and by default is set to Line. The following code switches the constant line style to Plane:
| C# |
Copy Code
|
constLine.Style = ConstLineStyle.Plane;
|
| Visual Basic |
Copy Code
|
constLine.Style = ConstLineStyle.Plane
|
Controlling the line appearance
When the constant line is visualized as line you can control the appearance of the line with the help of a NStrokeStyle object accessible trough the StrokeStyle property. The following snippet shows how to change the line color to blue:
| C# |
Copy Code
|
constLine.Style = ConstLineStyle.Line;
constLine.StrokeStyle.Color = Color.Blue;
|
| Visual Basic |
Copy Code
|
constLine.Style = ConstLineStyle.Line
constLine.StrokeStyle.Color = Color.Blue
|
When the constant line is visualized as plane you can also control the filling of the plane with the help of a NFillStyle object accessible trough the FillStyle property. In this case the StrokeStyle property controls the border of the plane. The following code will display a constant plane with red filling and black border:
| C# |
Copy Code
|
constLine.Style = ConstLineStyle.Plane;
constLine.FillStyle.SetSolidColor(Color.Red);
constLine.StrokeStyle.Color = Color.Black;
|
| Visual Basic |
Copy Code
|
constLine.Style = ConstLineStyle.Plane
constLine.FillStyle = New NColorFillStyle(Color.Red)
constLine.StrokeStyle.Color = Color.Black
|
Controlling the constant line begin and end values
By default constant lines are displayed across the entire chart area in their respective dimension. Sometimes you may need to specify a begin and end value of the constant line on a reference axis (parallel to the constant line). To do this you have to set the EnableBeginEnd property to true. Afterwards you need to set the desired begin/end value through the BeginValue and EndValue properties. Depending on which axis the constant line belongs to you can specify a reference axis at which the begin and end values will be scaled. This is achieved with the help of the BeginEndAxis property. Constant lines contained in vertical axes accept as a parameter only horizontal axes. Constant lines contained in a horizontal or depth axis accept the vertical axes as reference axes.
The following code will display the constant line from value 10 to value 20 on the PrimaryX axis.
| C# |
Copy Code
|
constLine.EnableBeginEnd = true;
constLine.BeginValue = 10;
constLine.EndValue = 20;
constLine.BeginEndAxis = (int)StandardAxis.PrimaryX;
|
| Visual Basic |
Copy Code
|
constLine.EnableBeginEnd = True
constLine.BeginValue = 10
constLine.EndValue = 20
constLine.BeginEndAxis = CType(StandardAxis.PrimaryX, Integer)
|
Const Line Text
Each const line can contain text that denotes the line meaning. The following code snippet applies text to a const line:
| C# |
Copy Code
|
|
NAxisConstLine yAxisConstLine = new NAxisConstLine();
yAxisConstLine.Value = 10;
yAxisConstLine.TextOffset = new NPointL(2, -2);
yAxisConstLine.TextAlignment = ContentAlignment.TopLeft;
yAxisConstLine.Text = "This is a const line";
someChart.Axis(StandardAxis.PrimaryY).ConstLines.Add(yAxisConstLine);
|
| Visual Basic |
Copy Code
|
|
Dim yAxisConstLine As New NAxisConstLine()
AxisConstLine.Value = 10
yAxisConstLine.TextOffset = New NPointL(2, -2)
yAxisConstLine.TextAlignment = ContentAlignment.TopLeft
yAxisConstLine.Text = "This is a const line"
someChart.Axis(StandardAxis.PrimaryY).ConstLines.Add(yAxisConstLine)
|
Including in the Axis Range
By default the axis const line values are not included in the calculation of the axis range they are attached to. In case you need to make sure that the const line value is always included in the axis range you can use the IncludeInAxisRange property:
| C# |
Copy Code
|
| constLine.IncludeInAxisRange = true; |
| Visual Basic |
Copy Code
|
| constLine.IncludeInAxisRange = True |
Related Examples
Windows forms: Axes \ Attributes \ Constlines
See Also