Custom Labels
In This Topic
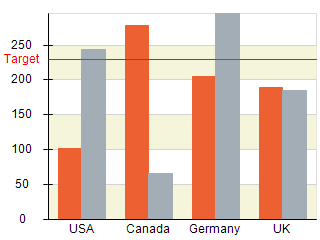
Custom labels can be applied on any scale configurator (although in the case of the hierarchical configurators all labels can be considered custom). This is done by adding instances of the NCustomValueLabel and NCustomRangleLabel classes to the CustomLabels collection of the configurator. The following pictures show two charts with custom value and range labels introduced to the Y and X axis respectively:
| Chart with Custom Value Label and Reference Line |
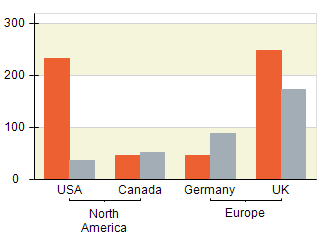
Chart with Custom Range Labels |
 |
 |
Adding Custom Value Labels
The following code will add a custom value label to the chart Y axis:
| C# |
Copy Code
|
|
// add custom label to the Y axis
NChart chart = nChartControl1.Charts[0];
NAxis yAxis = chart.Axis(StandardAxis.PrimaryY);
NCustomValueLabel valueLabel = new NCustomValueLabel(230, "Target");
yAxis.ScaleConfigurator.CustomLabels.Add(valueLabel);
|
| Visual Basic |
Copy Code
|
|
' add custom label to the Y axis
Dim chart As NChart = NChartControl1.Charts(0)
Dim yAxis As NAxis = chart.Axis(StandardAxis.PrimaryY)
Dim valueLabel As New NCustomValueLabel(230, "Target")
yAxis.ScaleConfigurator.CustomLabels.Add(valueLabel)
|
When you add the custom value label it will be created in a separate scale level. In certain cases however you may wish this label to be positioned alongside the labels generated by the scale. This is done by setting the CreateNewLevelForCustomLabels property to false:
| C# |
Copy Code
|
|
// add custom labels to the Y axis
NChart chart = nChartControl1.Charts[0];
NAxis yAxis = chart.Axis(StandardAxis.PrimaryY);
NCustomValueLabel valueLabel = new NCustomValueLabel(250, "Target");
// give higher priority to this label
valueLabel.Style.ZOrder = 1;
yAxis.ScaleConfigurator.CustomLabels.Add(valueLabel);
// tell the axis to remove labels that overlap with the custom label
yAxis.ScaleConfigurator.CustomLabelFitModes = new LabelFitMode[] { LabelFitMode.RemoveOverlap };
yAxis.ScaleConfigurator.CreateNewLevelForCustomLabels = false;
|
| Visual Basic |
Copy Code
|
|
' add custom labels to the Y axis
Dim chart As NChart = NChartControl1.Charts(0)
Dim yAxis As NAxis = chart.Axis(StandardAxis.PrimaryY)
Dim valueLabel As New NCustomValueLabel(250, "Target")
' give higher priority to this label
valueLabel.Style.ZOrder = 1
yAxis.ScaleConfigurator.CustomLabels.Add(valueLabel)
' tell the axis to remove labels that overlap with the custom label
yAxis.ScaleConfigurator.CustomLabelFitModes = New LabelFitMode() {LabelFitMode.RemoveOverlap}
yAxis.ScaleConfigurator.CreateNewLevelForCustomLabels = False
|
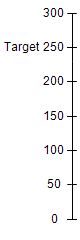
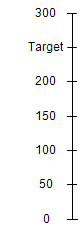
Note that the above code also changes the custom labels fit modes. This is required when you want to hide the labels that overlap with the custom label. The following pictures show two scales - the first one with a custom label in a separate level and the second one showing a custom label merged with the automatic labels:
Custom label in a separate
scale level |
Custom label merged with the
automatically generated labels |
 |
 |
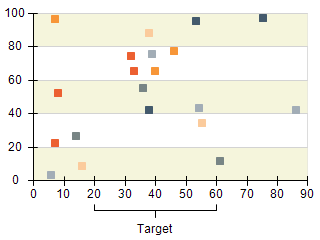
Adding Custom Range Labels
Similarly to value labels you add custom range labels by adding an instance of the NCustomRangeLabel class to the CustomLabels collection. The following code shows how to add a custom range label to the x axis of a simple XY scatter point chart:
| C# |
Copy Code
|
|
// add custom range label to the X axis
NChart chart = nChartControl1.Charts[0];
NAxis xAxis = chart.Axis(StandardAxis.PrimaryX);
NCustomRangeLabel rangeLabel = new NCustomRangeLabel();
rangeLabel.Text = "Target";
rangeLabel.Style.Offset = new NLength(10);
rangeLabel.Range = new NRange1DD(20, 60);
xAxis.ScaleConfigurator.CustomLabels.Add(rangeLabel);
|
| Visual Basic |
Copy Code
|
|
' add custom labels to the Y axis
Dim chart As NChart = NChartControl1.Charts(0)
Dim xAxis As NAxis = chart.Axis(StandardAxis.PrimaryX)
Dim rangeLabel As New NCustomRangeLabel
rangeLabel.Text = "Target"
rangeLabel.Style.Offset = New NLength(10)
rangeLabel.Range = New NRange1DD(20, 60)
xAxis.ScaleConfigurator.CustomLabels.Add(rangeLabel)
|
This code will produce the following image (provided that you already configured the point chart):
Related Examples
Windows Forms: Axes \ General \ Custom Range Labels
Windows Forms: Gauge Gallery \ Gauges \ Custom Range Labels
Web Forms: Axes \ General \ Custom Range Labels
Web Forms: Gauge Gallery \ Scales \ Custom Range Labels
See Also