Standard Bar
In This Topic
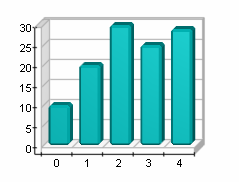
A Bar Chart displays a sequence of horizontal or vertical bars of lengths proportional to the value that they represent. Bar charts are used for comparing two or more values. The following images display standard bar charts.
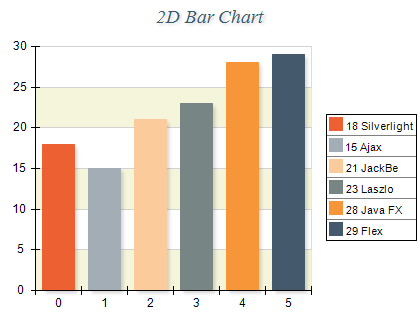
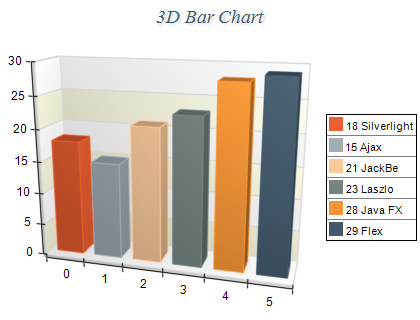
Figure 1.
Creating a bar series
Bar series are represented by the NBarSeries type. An instance of this type must be added to the series collection of a Cartesian chart.
| C# |
Copy Code
|
// obtain a reference to the Cartesian chart that is created by default
NCartesianChart chart = (NCartesianChart)chartControl.Charts[0];

// add bar series to it
NBarSeries bar = (NBarSeries)chart.Series.Add(SeriesType.Bar);
|
| Visual Basic |
Copy Code
|
' obtain a reference to the Cartesian chart that is created by default
Dim chart As NCartesianChart = chartControl.Charts(0)

' add bar series to it
Dim bar As NBarSeries = chart.Series.Add(SeriesType.Bar)
|
Passing Data
Once the bar series is created you can add some data in it. Bar series use the
Values data series for elevation values, the
XValues data series - for x position values and the
ZValues data series for depth position values. You can either manipulate directly these data series, or use the data point interface to add data. Please refer to the
Working with Data Points topic for more information.
Controlling the bars dimensions
The width and depth dimensions of the bars in a non-scatter bar series are specified in percents of the grid cell they occupy. The WidthPercent and DepthPercent properties control these percentage values. The following code will make the bars a little bit bolder then they are by default:
| C# |
Copy Code
|
bar.WidthPercent = 80;
bar.DepthPercent = 70;
|
| visual Basic |
Copy Code
|
bar.WidthPercent = 80
bar.DepthPercent = 70
|
When the UseXValues property is set to true, the bar width is controlled through the BarWidthMode, BarWidth and LogicalBarWidth properties. The following tabe shows how those three properties work together:
| BarWidthMode |
Description |
| Absolute |
The bar width is specified through the BarWidth property in abolute units (point, pixels etc.). |
| Logical |
The bar width is specified through the LogicalBarWidth property in logical (scale) units. |
When the UseZValues property is set to true, the bar depth is controlled through the BarDepth property. Both BarWidth and BarDepth are of type NLength and can be defined in percents of the chart dimensions. The following code will set the bar width to five percent of the chart width and the bar depth to two percent of the chart depth.
| C# |
Copy Code
|
bar.BarWidthMode = BarWidthMode.Absolute;
bar.BarWidth = new NLength(5, NRelativeUnit.ParentPercentage);
bar.BarDepth = new NLength(2, NRelativeUnit.ParentPercentage);
|
| Visual Basic |
Copy Code
|
bar.BarWidthMode = BarWidthMode.Absolute
bar.BarWidth = New NLength(5, NRelativeUnit.ParentPercentage)
bar.BarDepth = New NLength(2, NRelativeUnit.ParentPercentage)
|
Controlling the bar shape
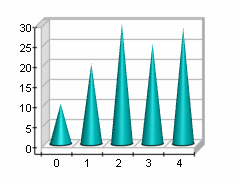
The shape of the bars is controlled with the help of the BarShape property. It accepts values from the BarShape enumeration. For example the following code will display the bars as cones:
| C# |
Copy Code
|
bar.BarShape = BarShape.Cone;
|
| Visual Basic |
Copy Code
|
bar.BarShape = BarShape.Cone
|
When the bars are displayed as Smooth or Cut edge bar you can control whether top and bottom edges of the bar are displayed in the respective manner with the help of the HasTopEdge and HasBottomEdge properties. The following code will display the bar as smooth edge bar with top and bottom edges:
| C# |
Copy Code
|
bar.BarShape = BarShape.SmoothEdgeBar;
bar.HasTopEdge = true;
bar.HasBottomEdge = true;
|
| Visual Basic |
Copy Code
|
bar.BarShape = BarShape.SmoothEdgeBar
bar.HasTopEdge = True
bar.HasBottomEdge = True
|
The size of the edge is controlled in percents of the smaller width or depth bar dimension. By default it is set to 15. The following code will make the smooth bar edges twice bigger:
| C# |
Copy Code
|
bar.BarEdgePercent = 30;
|
| Visual Basic |
Copy Code
|
bar.BarEdgePercent = 30
|
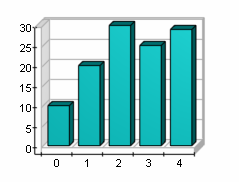
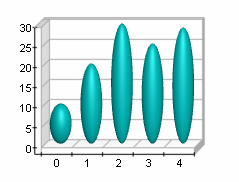
The following table shows bar charts with different styles:
| Bar |
Cylinder |
 |
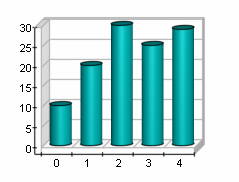 |
| Cone |
Pyramid |
 |
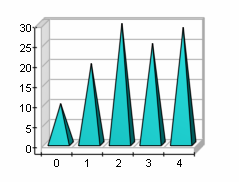 |
| Ellipsoid |
CutEdgeBar |
 |
 |
Controlling the bar origin
By default all bars are using 0 as origin value (all bars begin from 0). You can turn off this behavior by setting the UseOrigin property to false.
| C# |
Copy Code
|
bar.UseOrigin = false;
|
| Visual Basic |
Copy Code
|
bar.UseOrigin = False
|
If the bars do not use an origin value they will all begin from the minimum bar value (the minimal bar will be displayed with zero height).
In some cases you may want the bars to begin from a certain value - for example 15. The following code will achieve this result:
| C# |
Copy Code
|
bar.UseOrigin = true;
bar.Origin = 15;
|
| Visual Basic |
Copy Code
|
bar.UseOrigin = True
bar.Origin = 15
|
Palette
The bar series can have an associated palette, in which case the Fill properties of the series / data points are discarded. The following code snippet shows how to apply a palette filling:
| C# |
Copy Code
|
|
NPalette palette = new NPalette();
palette.Clear();
palette.Add(0, Color.Green);
palette.Add(60, Color.Yellow);
palette.Add(120, Color.Red);
barSeries.Palette = palette;
|
| Visual Basic |
Copy Code
|
|
Dim palette As New NPalette
palette.Clear()
palette.Add(0, Color.Green)
palette.Add(60, Color.Yellow)
palette.Add(120, Color.Red)
barSeries.Palette = palette
|
Connector Lines
The bar series can display connector lines which link the values of adjacent bars. The following code snippet shows how to enable connector lines and modify the connector lines stroke style:
| C# |
Copy Code
|
bar.ShowConnectorLines = true;
bar.ConnectorLineStrokeStyle = new NStrokeStyle(1, Color.Red); |
| Visual Basic |
Copy Code
|
bar.ShowConnectorLines = True
bar.ConnectorLineStrokeStyle = New NStrokeStyle(1, Color.Red) |
Bar Error Bars
The bar series can display errors bar for each individual bar. This is achieved by adding values to the UpperErrors and LowerErrors data series of the bar series:
| C# |
Copy Code
|
|
// get the cartesian chart created by default
NChart chart = nChartControl1.Charts[0];
// setup a bar series
NBarSeries bar = (NBarSeries)chart.Series.Add(SeriesType.Bar);
bar.DataLabelStyle.Visible = false;
bar.BorderStyle.Width = new NLength(0, NGraphicsUnit.Pixel);
bar.ShowLowerError = true;
bar.ShowUpperError = true;
// add some data to the bar series
bar.Values.Add(15);
bar.UpperErrors.Add(2);
bar.LowerErrors.Add(1);
bar.Values.Add(21);
bar.UpperErrors.Add(2.4);
bar.LowerErrors.Add(1.3);
bar.Values.Add(23);
bar.UpperErrors.Add(3.2);
bar.LowerErrors.Add(1.7);
|
| Visual Basic |
Copy Code
|
|
' get the cartesian chart created by default
Dim chart As NChart = NChartControl1.Charts(0)
' setup a bar series
Dim bar As NBarSeries = CType(chart.Series.Add(SeriesType.Bar), NBarSeries)
bar.DataLabelStyle.Visible = False
bar.BorderStyle.Width = New NLength(0, NGraphicsUnit.Pixel)
bar.ShowLowerError = True
bar.ShowUpperError = True
' add some data to the bar series
bar.Values.Add(15)
bar.UpperErrors.Add(2)
bar.LowerErrors.Add(1)
bar.Values.Add(21)
bar.UpperErrors.Add(2.4)
bar.LowerErrors.Add(1.3)
bar.Values.Add(23)
bar.UpperErrors.Add(3.2)
bar.LowerErrors.Add(1.7)
|
Bar Pixel Snapping
The bar series automatically pixel snaps all bars when they are rendered on the screen. In certain cased you may want to turn off this feature by using the EnableXPixelSnapping and EnableYPixelSnapping properties, which control the pixel snapping in the horizontal and vertical direction respectively:
| C# |
Copy Code
|
bar.EnableXPixelSnapping = false;
bar.EnableYPixelSnapping = false; |
| Visual Basic |
Copy Code
|
bar.EnableXPixelSnapping = False
bar.EnableYPixelSnapping = False |
Related Examples
Windows forms: Chart Gallery\Bar\
Wpf: Chart Gallery\Bar\
ASP.NET: Chart Gallery\Bar\
See Also