Box and Whiskers
In This Topic
Box and Whiskers plots are very helpful in interpreting the distribution of data. Each box and whiskers item represents a set of values and displays statistical information like minimum, maximum and median values, upper and lower quartiles, outliers and optionally a mean value.
The following figures display a standard Box and Whiskers Chart and a Box Plot with custom date-time positions. Please note that currently the Box and Whiskers series can be displayed only in 2D charts.
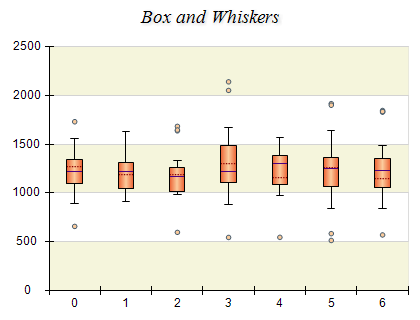
Figure 1.
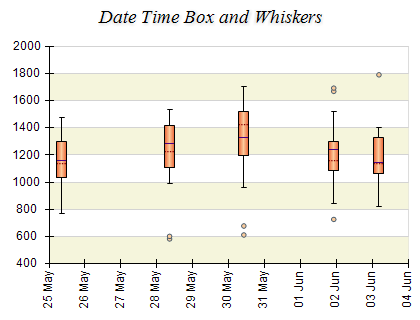
Figure 2.
Creating a Box and Whiskers series
Box and Whiskers series are represented by the NBoxAndWhiskersSeries type. An instance of this type must be added to the series collection of a Cartesian chart.
| C# |
Copy Code
|
// obtain a reference to the Cartesian chart that is created by default
NCartesianChart chart = (NCartesianChart)chartControl.Charts[0];

// add a box and whiskers series to it
NBoxAndWhiskersSeries boxAndWhiskers = (NBoxAndWhiskersSeries)chart.Series.Add(SeriesType.BoxAndWhiskers);
|
| Visual Basic |
Copy Code
|
' obtain a reference to the Cartesian chart that is created by default
Dim chart as NCartesianChart = chartControl.Charts(0)

' add a box and whiskers series to it
Dim boxAndWhiskers As NBoxAndWhiskersSeries = chart.Series.Add(SeriesType.BoxAndWhiskers)
|
Passing Data
Once the Box and Whiskers series is created you can add some data in it. Box and Whiskers series use the following data series:
UpperBoxValues - contains the upper box values (alias of th Values data series)
LowerBoxValues - contains the lower box values
UpperWhiskerValues - contains the upper whisker values
LowerWhiskerValues - contains the lower Whisker values
MedianValues - contains the median values (not mandatory)
AverageValues - contains the average values (not mandatory)
OutlierValues - contains arrays of outlier values (not mandatory)
XValues - contains the x position values
You can either manipulate directly these data series, or use the data point interface to add data. Please refer to the Working with Data Points topic for more information. The NBoxAndWhiskersDataPoint class provides several constructors that can be very helpful when you add box and whiskers data points. One of the constructors of the NBoxAndWhiskersDataPoint object can initialize the data point from a NDataSeries object that contains double values. The constructor automatically calculates the statistical parameters of the input data series like median value, upper and lower quartiles, interquartile range, minimum, maximum, average value and outliers.
The median, average and outlier values are not mandatory, which means that if you supply a DBNull.Value for one of these values, the data point will not be considered empty. The data point will be displayed, but the elements that correspond to the empty values will be missing. For example if you don't supply an average value for some data point, the data point will be displayed without the average value line.
Related Examples
Windows forms: Chart Gallery\Box And Whiskers\...
See Also