Smooth Area
In This Topic
Smooth Area charts are similar to Standard Area charts, the difference being that the successive data points are connected with cubic spline segments instead of straight lines. The following figure displays a Smooth Area chart.
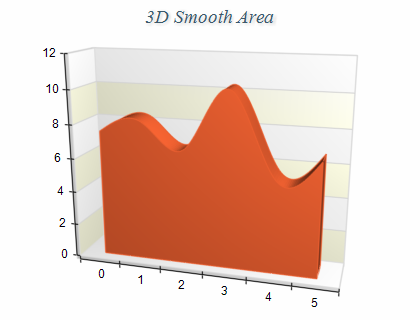
Figure 1.
Creating an area series
Smooth Area series are represented by the NSmoothAreaSeries type. An instance of this type must be added to the series collection of a Cartesian chart.
| C# |
Copy Code
|
// obtain a reference to the Cartesian chart that is created by default
NCartesianChart chart = (NCartesianChart)chartControl.Charts[0];

// add a smooth area series to the chart
NSmoothAreaSeries area = (NSmoothAreaSeries)chart.Series.Add(SeriesType.SmoothArea);
|
| Visual Basic |
Copy Code
|
' obtain a reference to the Cartesian chart that is created by default
Dim chart As NCartesianChart = chartControl.Charts(0)

' add a smooth area series to the chart
Dim area As NSmoothAreaSeries = chart.Series.Add(SeriesType.SmoothArea)
|
Passing Data
Once the series is created you can add some data in it. Smooth Area series use the
Values data series for the area elevation values and the
XValues data series for the custom x positions of the data points. The x values must be specified in ascending order. You can either manipulate directly the Values and XValues data series, or use the data point interface to add data. Please refer to the
Working with Data Points topic for more information.
Controlling the area depth
The depth of the area is specified in percents of the grid cell depth it occupies. The DepthPercent property controls this percentage. By default it is set to 50. The following code will make the area bigger in depth:
| C# |
Copy Code
|
area.DepthPercent = 70;
|
| Visual Basic |
Copy Code
|
area.DepthPercent = 70
|
Controlling the area origin
By default the area uses 0 as origin (the area begins from 0). You can change this behavior with the help of the OriginMode and Origin properties.
If the OriginMode is set to SeriesOriginMode.MinValue the area starts from the minimum value.
If the OriginMode is set to SeriesOriginMode.MaxValue the area starts from the maximum value.
In some cases you may want the area to begin from a certain value - for example 26. The following code demonstrates how to achieve this result:
| C# |
Copy Code
|
area.OriginMode = SeriesOriginMode.CustomOrigin;
area.Origin = 26;
|
| Visual Basic |
Copy Code
|
area.OriginMode = SeriesOriginMode.CustomOrigin
area.Origin = 26
|
Drop Lines
Drop lines are lines separating the area segments. You can controls their visibility with the help of the DropLines property. By default it is set to false. The following code will display the drop lines:
| C# |
Copy Code
|
area.DropLines = true;
|
| Visual Basic |
Copy Code
|
area.DropLines = True
|
The following image displays a Date/Time Smooth Area chart with drop lines.
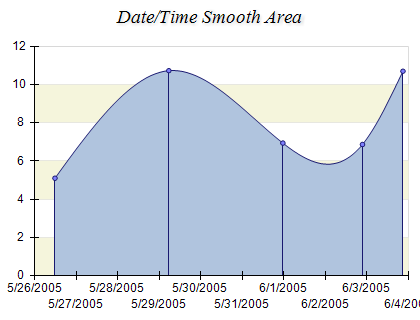
figure 2.
Palette
The area series can have an associated palette, in which case the Fill properties of the series / data points are discarded. The following code snippet shows how to apply a palette filling:
| C# |
Copy Code
|
|
NPalette palette = new NPalette();
palette.Clear();
palette.Add(0, Color.Green);
palette.Add(60, Color.Yellow);
palette.Add(120, Color.Red);
areaSeries.Palette = palette;
|
| Visual Basic |
Copy Code
|
|
Dim palette As New NPalette
palette.Clear()
palette.Add(0, Color.Green)
palette.Add(60, Color.Yellow)
palette.Add(120, Color.Red)
areaSeries.Palette = palette
|
Related Examples
Chart Gallery\Smooth Area\Smooth Area
Chart Gallery\Smooth Area\XY Smooth Area
Chart Gallery\Smooth Area\Date-Time Smooth Area
See Also