Nevron .NET Vision
Chart for .NET / User's Guide / Chart Types / Line / Stacked Line

In This Topic
    Stacked Line
    In This Topic

    A Stacked Line chart displays related data groups, one on top of the other. It is used to show how each group contributes to the total as well as the trends of the total, usually over time. The individual series are displayed as sequences of straight line segments. Each line series is stacked on top of the previous one. The following figure displays a Stacked Line chart:


    Figure 1.

     Creating the stacked line chart

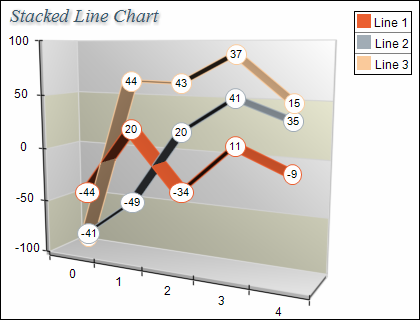
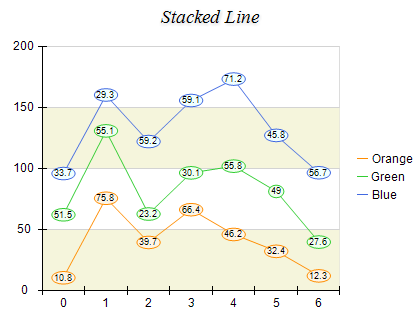
    Stacked Line charts are displayed with several NLineSeries objects. The MultiLineMode property of the first line series must be set to MultiLineMode.Series. The MultiLineMode property of the subsequent line series must be set to MultiLineMode.Stacked. The following example demonstrates how to create a stack line chart with two stacks:

    C#
    Copy Code
    // obtain a reference to the Cartesian chart that is created by default
    NCartesianChart chart = (NCartesianChart)chartControl.Charts[0];
    
    NLineSeries line1 = (NLineSeries)chart.Series.Add(SeriesType.Line);
    NLineSeries line2 = (NLineSeries)chart.Series.Add(SeriesType.Line);
    
    line1.MultiLineMode = MultiLineMode.Series;
    line2.MultiLineMode = MultiLineMode.Stacked;
    
    Visual Basic
    Copy Code
    ' obtain a reference to the Cartesian chart that is created by default
    Dim chart As NCartesianChart = chartControl.Charts(0)
    
    Dim line1 As NLineSeries = chart.Series.Add(SeriesType.Line)
    Dim line2 As NLineSeries = chart.Series.Add(SeriesType.Line)
    
    line1.MultiLineMode = MultiLineMode.Series
    line2.MultiLineMode = MultiLineMode.Stacked
    

    If you want to create a second stacked line with two stacks behind the stack line created in the previous sample you must add the following code:

    C#
    Copy Code
    NLineSeries line4 = (NLineSeries)chart.Series.Add(SeriesType.Line);
    NLineSeries line5 = (NLineSeries)chart.Series.Add(SeriesType.Line);
    
    line4.MultiLineMode = MultiLineMode.Series;
    line5.MultiLineMode = MultiLineMode.Stacked;
    
    Visual Basic
    Copy Code
    Dim line4 As NLineSeries = chart.Series.Add(SeriesType.Line)
    Dim line5 As NLineSeries = chart.Series.Add(SeriesType.Line)
    
    line4.MultiLineMode = MultiLineMode.Series
    line5.MultiLineMode = MultiLineMode.Stacked
    
     Stacks with negative values

    Stacked line charts support negative values, which means that if you insert negative values in the Values data series the respective stacks will be piled below the zero. In this case since the values for a concrete category can be both positive and negative the chart will display two piles for each category - one for the positive values which grows above the zero and another one for the negative values which grows below the zero.

    The following figure demonstrates a stack line chart with negative and positive values:


    figure 2.

     Formatting Commands

    The following formatting commands inherited from the NSeries class have different meaning when a line series is stacked:

    <total> - displays the positive or negative values sum of the values in the current stack. If the current value is negative the negative sum is displayed otherwise the positive sum is displayed.
    <cumulative> - displays the sum of the values up to the current stack value.
    <percent> - displays the percent contribution of the value to the total pile sum.

     Related Examples
    Windows forms: Chart Gallery\Line\Stacked Line
    See Also