Nevron Chart for .NET uses a declarative scale model to describe the axis scale, scale decorations and wall decorations. This is referred to as Scale in the documentation. The component also exposes a higher level API that allows you to configure the scale in a more intuitive and straightforward manner - this set of objects is referred to as Scale Configurator in the documentation. The following diagram shows how the Scale Configurator, Scale and Axis objects work together:
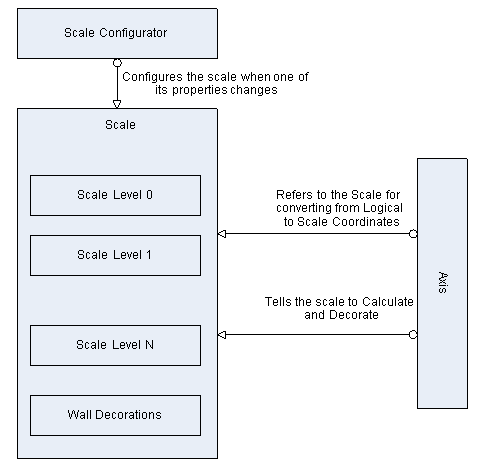
figure 1.
From this conceptual overview it’s clear that the scale can work autonomously from the scale configurator, because the axis always refers to it when it needs it to perform Logical to Scale transformations or when it needs to decorate (create the ticks and labels) on the scale.
This model has several advantages over traditional axis models that nest the scale in the axis:
1. You’re not locked down to a static API for defining how the scale is decorated, measured or how many levels it will contain, because you can always turn off the synchronization between the scale configurator and the scale and manually alter the scale definition.
2. When you work with the higher level API (Scale Configurator) it will create a scale definition that will exactly match the visible properties of the axis. For example consider the minor ticks – when they are not visible there is no need to check at each chart rendering whether they are visible or not – instead the scale configurator will simply not specify them in the scale definition. This will reduce the processing needed to decorate and calculate the scale by avoiding redundant checks for visibility.