Indicators Overview
In This Topic
Overview
Indicators pinpoint important values or ranges on the gauge axes. Each gauge can contain an unlimited number of indicators. Adding or removing gauge indicators is done by modifying the contents of the Indicators collection of the gauge.
There are two general classes of indicators – value and range indicators. As the name suggests value indicators are used to pin point a value whereas range indicators show a range of values on a gauge axis.
The following table shows the possible types of indicators that can be contained in a gauge:
| Indicator Type |
Description |
Applies to |
| NMarkerValueIndicator |
Represents a marker shown at a specified value on the gauge axis |
Linear and Radial gauges |
| NNeedleValueIndicator |
Represents a needle connecting the radial gauge center point (pin) and a point specified in axis scale coordinates |
Radial gauges |
| NRangeIndicator |
Represents a range of values on the gauge axis. |
Linear and Radial gauges |
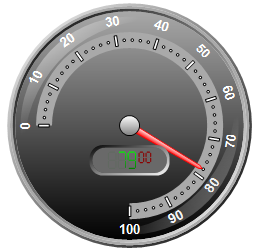
Indicator Z Order
The indicator paint order it controlled through the PaintOrder property. It allows you to choose from three options as shown in the following table:
| AfterChildPanels |
AfterScale |
BeforeScale |
 |
 |
 |
By default range indicators and marker indicators use BeforeScale and needle indicators use AfterChildPanels. This allows you to add child panels as shown in the above picture without hiding the needle. The following code changes the paint order to AfterScale:
| C# |
Copy Code
|
someIndicator.PaintOrder = IndicatorPaintOrder.AfterScale;
|
| Visual Basic |
Copy Code
|
someIndicator.PaintOrder = IndicatorPaintOrder.AfterScale
|
The order in which the gauge will paint indicators with equal paint order is defined by their position in the Indicators collection of the gauge. The gauge will paint the indicators starting from the first one (which will appear on the bottom) and end with the last indicators which will be topmost. Therefore when you mix indicators you should be careful about the order in which you add them to the Indicators collection. Typically you should place range indicators before needle and marker indicators.
The following code will swap the Z order of two indicators:
| C# |
Copy Code
|
nChartControl1.Panels.Clear();

NRadialGaugePanel radialGauge = new NRadialGaugePanel();
nChartControl1.Panels.Add(radialGauge);

radialGauge.Indicators.Add(new NMarkerValueIndicator(10));
radialGauge.Indicators.Add(new NNeedleValueIndicator(20));

// later in code
if (radialGauge.Indicators.Count > 2)
{
        NIndicator temp = (NIndicator)radialGauge.Indicators[0];
        radialGauge.Indicators[0] = radialGauge.Indicators[1];
        radialGauge.Indicators[1] = temp;
}
|
| Visual Basic |
Copy Code
|
NChartControl1.Panels.Clear()

Dim radialGauge As New NRadialGaugePanel
NChartControl1.Panels.Add(radialGauge)

radialGauge.Indicators.Add(New NMarkerValueIndicator(10))
radialGauge.Indicators.Add(New NNeedleValueIndicator(20))

' later in code
If radialGauge.Indicators.Count > 2 Then
    Dim temp As NIndicator = CType(radialGauge.Indicators(0), NIndicator)
    radialGauge.Indicators(0) = radialGauge.Indicators(1)
    radialGauge.Indicators(1) = temp
End If
|
Indicator Axis
All indicators must have an axis where they scale on. If you do not specify an axis explicitly the indicator will scale on the first axis in the gauge axis collection. The following code will create a simple radial panel with two axes and two indicators:
| C# |
Copy Code
|
nChartControl1.Panels.Clear();
NRadialGaugePanel radialGauge = new NRadialGaugePanel();

NGaugeAxis axis = new NGaugeAxis();
axis.Range = new NRange1DD(100, 200);
radialGauge.Axes.Add(axis);

NMarkerValueIndicator marker1 = new NMarkerValueIndicator(20);
radialGauge.Indicators.Add(marker1);

NMarkerValueIndicator marker2 = new NMarkerValueIndicator(120);
marker2.Axis = axis;
radialGauge.Indicators.Add(marker2);

nChartControl1.Panels.Add(radialGauge);
nChartControl1.Refresh();
|
| Visual Basic |
Copy Code
|
NChartControl1.Panels.Clear()
Dim radialGauge As New NRadialGaugePanel

Dim axis As New NGaugeAxis
axis.Range = New NRange1DD(100, 200)
radialGauge.Axes.Add(axis)

Dim marker1 As New NMarkerValueIndicator(20)
radialGauge.Indicators.Add(marker1)

Dim marker2 As New NMarkerValueIndicator(120)
marker2.Axis = axis
radialGauge.Indicators.Add(marker2)

NChartControl1.Panels.Add(radialGauge)
NChartControl1.Refresh()
|
Note: In the code above the first marker is implicitly associated with the first gauge axis, because the code does not assign an axis to it.
Offset From Scale
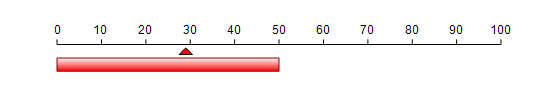
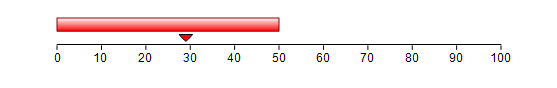
Each indicator has a property called OffsetFromScale that allows you to control how the indicator is offset from the axis scale it is attached to. The offset is specified in NLength format where negative values mean offset to the right side of the ruler and positive values mean the opposite. Note that the offset is synchronized with the ruler orientation. The following pictures show how two indicators – marker and range indicator scale on a linear gauge depending on the offset from scale property and the axis ruler orientation:
| Two indicators with negative offset on a left oriented gauge axis |
 |
| Two indicators with negative offset on a right oriented gauge axis |
 |
The following code will replicate the gauge configuration from the first picture:
| C# |
Copy Code
|
nChartControl1.Panels.Clear();
NLinearGaugePanel linearGauge = new NLinearGaugePanel();
nChartControl1.Panels.Add(linearGauge);

NGaugeAxis axis = (NGaugeAxis)linearGauge.Axes[0];
axis.Anchor = new NModelGaugeAxisAnchor(new NLength(0), VertAlign.Center, RulerOrientation.Left, 0, 100);
NStandardScaleConfigurator scale = (NStandardScaleConfigurator)axis.ScaleConfigurator;
scale.SetPredefinedScaleStyle(PredefinedScaleStyle.Scientific);

NRangeIndicator rangeIndicator = new NRangeIndicator();
rangeIndicator.Value = 50;
rangeIndicator.FillStyle = new NGradientFillStyle(Color.White, Color.Red);
rangeIndicator.OffsetFromScale = new NLength(-10);
linearGauge.Indicators.Add(rangeIndicator);

NMarkerValueIndicator markerIndicator = new NMarkerValueIndicator();
markerIndicator.Value = 29;
markerIndicator.Shape.FillStyle = new NColorFillStyle(Color.Red);
markerIndicator.OffsetFromScale = new NLength(-5);
linearGauge.Indicators.Add(markerIndicator);
|
Value Dampening
All types of indicators support the value dampening effect feature which allows you to smooth the indicator movement when its value (or range) changes. The dampening effect in essence distributes the indicator value change over time producing a smooth movement of the indicator when its value or range changes. You enable dampening by setting the EnableDampening property of the indicator to true. The DampeningSteps property controls the number of steps the control will make to move from the old value of the indicator to the new one. The time interval between these steps is specified by the DampeningInterval property, which is specified in milliseconds. The following code snippets show how to to change the dampening steps (10 by default) and interval (50ms by default) of a marker value indicator:
| C# |
Copy Code
|
|
NMarkerValueIndicator indicator = new NMarkerValueIndicator();
indicator.EnableDampening = true;
indicator.DampeningInterval = 25;
indicator.DampeningSteps = 20;
someGauge.Indicators.Add(indicator);
|
| Visual Basic |
Copy Code
|
|
Dim indicator As New NMarkerValueIndicator
indicator.EnableDampening = True
indicator.DampeningInterval = 25
indicator.DampeningSteps = 20
someGauge.Indicators.Add(indicator)
|
Indicator Palette
All indicators can have an associated palette, in which case the Fill property of the indicator is discarded. The following code snippet shows how to apply a palette filling to a range indicator:
| C# |
Copy Code
|
|
// clear panels
nChartControl1.Panels.Clear();
NRadialGaugePanel radialGauge = new NRadialGaugePanel();
nChartControl1.Panels.Add(radialGauge);
((NGaugeAxis)radialGauge.Axes[0]).Range = new NRange1DD(0, 100);
// add radial gauge indicator
NRangeIndicator rangeIndicator = new NRangeIndicator();
radialGauge.Indicators.Add(rangeIndicator);
rangeIndicator.PaletteColorMode = PaletteColorMode.Spread;
rangeIndicator.Value = 100;
NPalette palette = new NPalette();
rangeIndicator.Palette = palette;
palette.Clear();
palette.SmoothPalette = true;
palette.Add(0, Color.Green);
palette.Add(50, Color.Yellow);
palette.Add(100, Color.Red);
|
| Visual Basic |
Copy Code
|
|
' clear panels
NChartControl1.Panels.Clear()
Dim radialGauge As New NRadialGaugePanel()
NChartControl1.Panels.Add(radialGauge)
CType(radialGauge.Axes(0), NGaugeAxis).Range = New NRange1DD(0, 100)
' add radial gauge indicator
Dim rangeIndicator As New NRangeIndicator()
radialGauge.Indicators.Add(rangeIndicator)
rangeIndicator.PaletteColorMode = PaletteColorMode.Spread
rangeIndicator.Value = 100
Dim palette As New NPalette
rangeIndicator.Palette = palette
palette.Clear()
palette.SmoothPalette = True
palette.Add(0, Color.Green)
palette.Add(50, Color.Yellow)
palette.Add(100, Color.Red)
|
Related Examples
Windows forms: Gauge Gallery\Gauges\Indicators
Web forms: Gauge Gallery\Gauges\Indicators
See Also