Scale sections allow you to alter the appearance of different scale elements if they fall in a specified range. This allows you to visually highlight important ranges of data that the user has to pay special attention to.
The following picture shows four scale sections – two defined for the primary Y axis and two defined on the primary X axis:
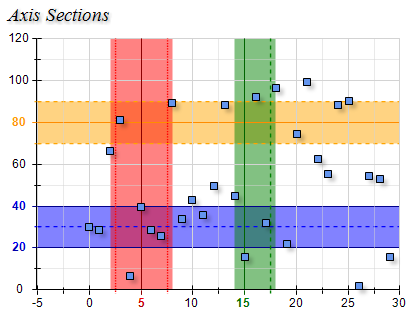
You create a scale section by creating an instance of the NScaleSectionStyle class. The following code will create the red axis section displayed on the above picture:
| C# |
Copy Code
|
|---|---|
NCartesianChart chart = (NCartesianChart)nChartControl1.Charts[0]; // create the scale section NScaleSectionStyle scaleSection = new NScaleSectionStyle(); scaleSection.Range = new NRange1DD(2, 8); // display the range on the back wall scaleSection.SetShowAtWall(ChartWallType.Back, true); scaleSection.RangeFillStyle = new NColorFillStyle(Color.FromArgb(125, Color.Red)); // alter the major and minor grid stroke style if lines fall in the range [2, 8] scaleSection.MajorGridStrokeStyle = new NStrokeStyle(Color.Red); scaleSection.MajorTickStrokeStyle = new NStrokeStyle(Color.DarkRed); scaleSection.MinorTickStrokeStyle = new NStrokeStyle(1, Color.Red, (int)LinePattern.Dot, 2); // alter the text style of the automatic labels NTextStyle labelStyle = new NTextStyle(); labelStyle.FillStyle = new NGradientFillStyle(Color.Red, Color.DarkRed); labelStyle.FontStyle.Style = FontStyle.Bold; scaleSection.LabelTextStyle = labelStyle; // add the scale section to the primary X axis NAxis primaryX = chart.Axis(StandardAxis.PrimaryX); NStandardScaleConfigurator scaleConfigurator = (NStandardScaleConfigurator)primaryX.ScaleConfigurator; scaleConfigurator.Sections.Add(scaleSection); nChartControl1.Refresh(); |
|
| Visual Basic |
Copy Code
|
|---|---|
Dim chart As NCartesianChart = NChartControl1.Charts(0) ' create the scale section Dim scaleSection As New NScaleSectionStyle scaleSection.Range = New NRange1DD(2, 8) ' display the range on the back wall scaleSection.SetShowAtWall(ChartWallType.Back, True) scaleSection.RangeFillStyle = New NColorFillStyle(Color.FromArgb(125, Color.Red)) ' alter the major and minor grid stroke style if lines fall in the range [2, 8] scaleSection.MajorGridStrokeStyle = New NStrokeStyle(Color.Red) scaleSection.MajorTickStrokeStyle = New NStrokeStyle(Color.DarkRed) scaleSection.MinorTickStrokeStyle = New NStrokeStyle(1, Color.Red, LinePattern.Dot, 2) ' alter the text style of the automatic labels Dim labelStyle As New NTextStyle labelStyle.FillStyle = New NGradientFillStyle(Color.Red, Color.DarkRed) labelStyle.FontStyle.Style = FontStyle.Bold scaleSection.LabelTextStyle = labelStyle ' add the scale section to the primary X axis Dim primaryX As NAxis = chart.Axis(StandardAxis.PrimaryX) Dim scaleConfigurator As NStandardScaleConfigurator = CType(primaryX.ScaleConfigurator, NStandardScaleConfigurator) scaleConfigurator.Sections.Add(scaleSection) NChartControl1.Refresh() |
|