Content Panels Overview
In This Topic
Each panel that has paintable content inherits directly or indirectly from the NContentPanel class. In practice all chart panels except the root are content panels.
The content panel has several properties controlling it's visibility, size, content alignment and bounds mode. The following sections discuss each one of them in detail.
Visibility
The visibility of each content panel is controlled through the Visible property. By default this property is set to true, but you can set it to false if you want to hide a panel. The following code will hide the first chart in the Charts collection.
| C# |
Copy Code
|
NChart chart = chartControl.Charts[0];
chart.Visible = false;
chartControl.Refresh();
|
| Visual Basic |
Copy Code
|
Dim chart As NChart = chartControl.Charts(0)

chart.Visible = False

chartControl.Refresh()
|
Size
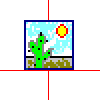
The size of the panel is controlled by the Size property accepting values in NSizeL format. Note that this property may be discarded in the layout calculation if one of the following conditions are met:
- The panel is in docking mode. In this case only the relevant dimensions (Width or Height) will be taken into account when calculating the bounds of the panel. This applies only to panels that are dockable.
- The panel is in auto size mode. In this case the panel will automatically compute its best size and the value of the Size property is discarded. This applies only to auto sizeable panels.
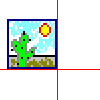
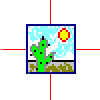
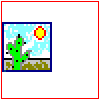
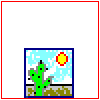
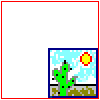
The following example will create a watermark image with gradient fill style occupying the left top corner of the chart canvas.
| C# |
Copy Code
|
NWatermark watermark = new NWatermark();
watermark.Location = new NPointL(0, 0);
watermark.Size = new NSizeL( new NLength(50, NRelativeUnit.ParentPercentage), new NLength(50, NRelativeUnit.ParentPercentage));
watermark.UseAutomaticSize = false;
watermark.FillStyle = new NGradientFillStyle(GradientStyle.Horizontal, GradientVariant.Variant1, Color.White, Color.DarkBlue);

chartControl.Panels.Add(watermark);
|
| Visual Basic |
Copy Code
|
Dim watermark As New NWatermark
watermark.Location = New NPointL(0, 0)
watermark.Size = New NSizeL(New NLength(50, NRelativeUnit.ParentPercentage), New NLength(50, NRelativeUnit.ParentPercentage))
watermark.UseAutomaticSize = False
watermark.FillStyle = New NGradientFillStyle(GradientStyle.Horizontal, GradientVariant.Variant1, Color.White, Color.DarkBlue)

chartControl.Panels.Add(watermark)
|
Note that we turned off the automatic size calculation for the panel (UseAutomaticSize = false).
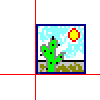
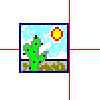
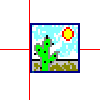
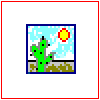
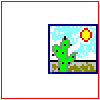
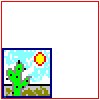
Content Alignment
Fit Alignment
See Also