Standard Line
In This Topic
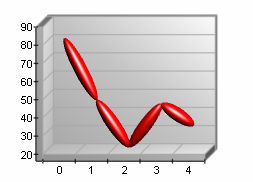
A Line Chart displays a sequence of data points connected by a line. Consecutive points are connected with straight line segments. The following images display standard line charts.
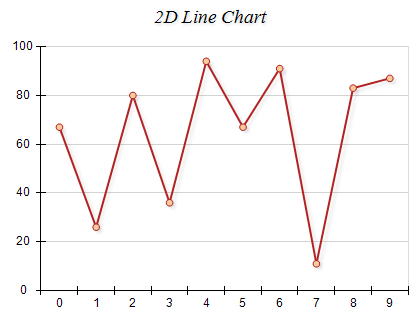
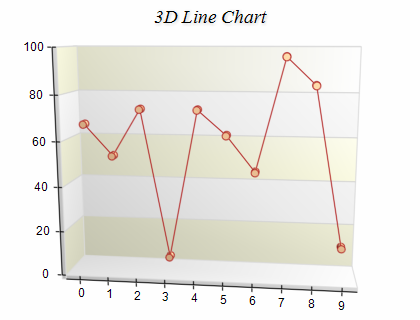
Figure 1.
Creating a line series
Line series are represented by the NLineSeries type. An instance of this type must be added to the series collection of a Cartesian chart.
| C# |
Copy Code
|
// obtain a reference to the Cartesian chart that is created by default
NCartesianChart chart = (NCartesianChart)chartControl.Charts[0];

// add line series to it
NLineSeries line = (NLineSeries)chart.Series.Add(SeriesType.Line);
|
| Visual Basic |
Copy Code
|
' obtain a reference to the Cartesian chart that is created by default
Dim chart As NCartesianChart = chartControl.Charts(0)

' add line series to it
Dim line As NLineSeries = chart.Series.Add(SeriesType.Line)
|
Passing Data
Once the line series is created you can add some data in it. Line series use the
Values data series for elevation values, the
XValues data series - for x position values and the
ZValues data series for depth position values. You can either manipulate directly these data series, or use the data point interface to add data. Please refer to the
Working with Data Points topic for more information.
Controlling the line shape
The line segments can be visualized with different shapes. You can control the shape with the help of the LineSegmentShape property which accepts values from the LineSegmentShape enumeration. By default the series is displayed as simple line. The following example will display the series as tape:
| C# |
Copy Code
|
line.LineSegmentShape = LineSegmentShape.Tape;
|
| Visual Basic |
Copy Code
|
line.LineSegmentShape = LineSegmentShape.Tape
|
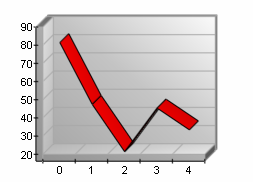
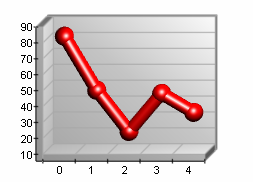
| Demonstration of line styles |
| Tape |
Tube (with Sphere Markers) |
Ellipsoid |
 |
 |
 |
Controlling the line depth
When a standard line chart is displayed in Tape, Tube or Ellipsoid mode, the DepthPercent property of the NLineSeries object specifies the depth of the line segments in percent of the floor grid cells. By default it is set to 50. The following code will make the line bigger in depth:
| C# |
Copy Code
|
line.DepthPercent = 60;
|
| Visual Basic |
Copy Code
|
line.DepthPercent = 60
|
In case of XYZ scatter line the depth is controlled through the LineSize property of the NLineSeries object.
If the line series is displayed as a simple line, the width of the line is controlled through the stroke style of the current data point.
Line Sampling
The line series can operate in a special mode called sampled line rendering, which allows you to display very large data sets interactively. This is achieved by filtering individual line segments and displaying a single line segment that has the direction, minimum and maximum values of the line segments that comprise it. This reduces the number of visual line segments and therefore leads to improved performance. When using sampling the line series will not regard settings for markers, data labels, individual appearance styles and shadow.
In order to enable sampling you have to set the SamplingMode property of the series, which accepts values from the SeriesSamplingMode enumeration:
| Series Sampling Mode |
Description |
| Auto |
The line series will automatically use sampling if possible. This setting regards the settings for markers, data labels and individual line segment appearance styles. This is the default setting. |
| Enabled |
The line series will always use sampling and will discard settings for markers, data labels and individual line segment appearance styles. |
| Disabled |
The line series will not use sampling. |
The SampleDistance property specified in NLength format controls the precision of the line series when it aggregates adjacent line segments. By default this setting is set to 1 pixel. The following code shows how to enable sampling and decrease the sampling precision to 2 pixels:
| C# |
Copy Code
|
|
NLineSeries line = new NLineSeries();
line.SamplingMode = SeriesSamplingMode.Enabled;
line.SampleDistance = new NLength(2, NGraphicsUnit.Pixel);
|
| Visual Basic |
Copy Code
|
|
Dim line As New NLineSeries
line.SamplingMode = SeriesSamplingMode.Enabled
line.SampleDistance = New NLength(2, NGraphicsUnit.Pixel)
|
Intersecting With X/Y Value
The line series supports two methods called IntersectWithXValue and IntersectWithYValue, which allow you to get the intersections of the line with a vertical or horizontal line at the specified x or y value respectively. For example:
| C# |
Copy Code
|
| List<double> intesections = line.IntersectWithXValue(xValue); |
| Visual Basic |
Copy Code
|
| Dim intesections As List(Of Double) = line.IntersectWithXValue(xValue) |
gets a list of the intersections of the line with a vertical line at the specified xValue.
Related Examples
Windows forms: Chart Gallery\Line\Standard Line
Windows forms: Chart Gallery\Line\Sampled 2D Line
Windows forms: Chart Gallery\Line\Sampled 3D Line
Windows forms: Chart Gallery\Line\Intersect Line with X/Y Value
See Also