
The sizes and positions of Chart Elements are specified in four different types of units:
-
Percentage - chart elements, which need to be dynamically resized based on the Chart Image width and height as well as elements, which are dependant on dynamic chart changes (series size, data point count etc.) are often specified in percentages.
For example the position of the Header text is determined by an origin point whose coordinates (X,Y) is specified in percents of the Chart Image Width and Height.
Another example is the depth of the bars - it is specified in percents of the series depth (determined dynamically based on the series count). -
Pixel - elements properties, which need to be defined in exact pixels size independent of the Chart Image size are specified in pixels.
For example the inflate of the text frame width and height is specified in pixels, since the user has to be precise in this setting which is most commonly performed as an adjustment for a specific Chart Image size. -
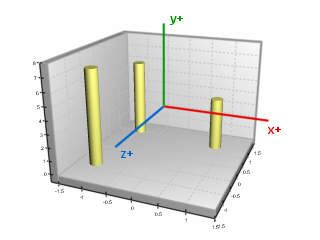
Model - chart elements which are displayed in 3D Layers (for example the Chart itself) use these measurement units. In general Nevron Chart builds a 3D Model of the chart and renders it. The size of the Model units in pixels is dependant from the used chart projection, chart margins and chart margin fit mode.
For example the Chart parallelepiped width, height and depth are specified in the Model units.
Another example is the Markers width and height, which are also specified in Model units.
In certain projections you can think of model units as percents. For more information check out the Chart Area Margins topic. -
Scale - scale units are units, which are scaled on the Chart Axes. In fact all data displayed by the Series is in Scale units. Scale units are internally converted to Model units by the Axis Scales.
For example a bar data point with value 10 can be 150 pixels in height if the values contained by the bar series range from 0 to 20. If the values contained by the same bar series range from 0 to 40 the same bar will be 75 pixels in height although its value will still be 10.