Standard Area
In This Topic
Area charts depict changes of values, usually over time. They are similar to Line charts, but emphasize the trends by filling the area between axis and line. The following figures display standard area charts.
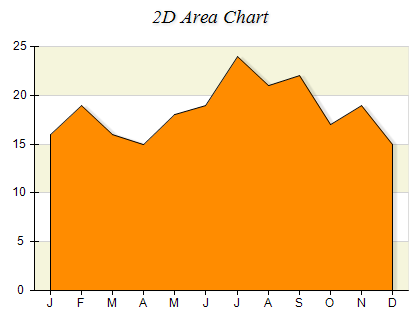
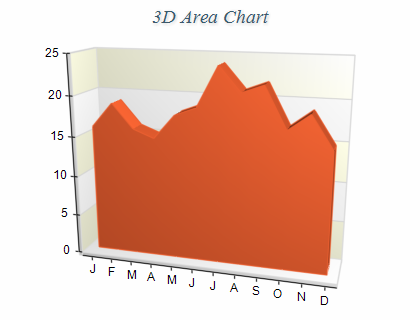
Figure 1.
Creating an area series
Area series are represented by the NAreaSeries type. An instance of this type must be added to the series collection of a Cartesian chart.
| C# |
Copy Code
|
// obtain a reference to the Cartesian chart that is created by default
NCartesianChart chart = (NCartesianChart)chartControl.Charts[0];

// add an area series to the chart
NAreaSeries area = (NAreaSeries)chart.Series.Add(SeriesType.Area);
|
| Visual Basic |
Copy Code
|
' obtain a reference to the Cartesian chart that is created by default
Dim chart As NCartesianChart = chartControl.Charts(0)

' add an area series to the chart
Dim area As NAreaSeries = chart.Series.Add(SeriesType.Area)
|
Passing Data
Once the area series is created you can add some data in it. Area series use the
Values data series for the area elevation values and the
XValues data series for the custom x positions of the data points. You can either manipulate directly the
Values and
XValues data series, or use the data point interface to add data. Please refer to the
Working with Data Points topic for more information.
Controlling the area depth
The depth of the area is specified in percents of the grid cell depth it occupies. The DepthPercent property controls this percentage. By default it is set to 50. The following code will make the area bigger in depth:
| C# |
Copy Code
|
area.DepthPercent = 70;
|
| Visual Basic |
Copy Code
|
area.DepthPercent = 70
|
Controlling the area origin
By default the area uses 0 as origin (the area begins from 0). You can turn off this behavior by setting the UseOrigin property to false.
| C# |
Copy Code
|
area.UseOrigin = false;
|
| Visual Basic |
Copy Code
|
area.UseOrigin = False
|
If the area is not using an origin value it will begin from the minimum area value (the minimal area value will be displayed with zero height).
In some cases you may want the area to begin from a certain value - for example 26. The following code demonstrates how to achieve this result:
| C# |
Copy Code
|
area.UseOrigin = true;
area.Origin = 26;
|
| Visual Basic |
Copy Code
|
area.UseOrigin = True
area.Origin = 26
|
Drop Lines
Drop lines are lines separating the area segments. You can controls their visibility with the help of the DropLines property. By default it is set to false. The following code will display the drop lines:
| C# |
Copy Code
|
area.DropLines = false;
|
| Visual Basic |
Copy Code
|
area.DropLines = False
|
Area Sampling
The area series can operate in a special mode called sampled area rendering, which allows you to display very large data sets interactively. This is achieved by filtering individual area segments and displaying a single area segment that has the minimum and maximum values of the area segments that comprise it. This reduces the number of visual area segments and therefore leads to improved performance. When using sampling the area series will not regard settings for markers, data labels, individual appearance styles and shadow.
In order to enable sampling you have to set the SamplingMode property of the series, which accepts values from the SeriesSamplingMode enumeration:
| Series Sampling Mode |
Description |
| Auto |
The area series will automatically use sampling if possible. This setting regards the settings for markers, data labels and individual area segment appearance styles. This is the default setting. |
| Enabled |
The area series will always use sampling and will discard settings for markers, data labels and individual area segment appearance styles. |
| Disabled |
The area series will not use sampling. |
The SampleDistance property specified in NLength format controls the precision of the area series when it aggregates adjacent area segments. By default this setting is set to 1 pixel. The following code shows how to enable sampling and decrease the sampling precision to 2 pixels:
| C# |
Copy Code
|
|
NAreaSeries area = new NAreaSeries();
area.SamplingMode = SeriesSamplingMode.Enabled;
area.SampleDistance = new NLength(2, NGraphicsUnit.Pixel);
|
| Visual Basic |
Copy Code
|
|
Dim area As New NAreaSeries
area.SamplingMode = SeriesSamplingMode.Enabled
area.SampleDistance = New NLength(2, NGraphicsUnit.Pixel)
|
Palette
The area series can have an associated palette, in which case the Fill properties of the series / data points are discarded. The following code snippet shows how to apply a palette filling:
| C# |
Copy Code
|
|
NPalette palette = new NPalette();
palette.Clear();
palette.Add(0, Color.Green);
palette.Add(60, Color.Yellow);
palette.Add(120, Color.Red);
areaSeries.Palette = palette;
|
| Visual Basic |
Copy Code
|
|
Dim palette As New NPalette
palette.Clear()
palette.Add(0, Color.Green)
palette.Add(60, Color.Yellow)
palette.Add(120, Color.Red)
areaSeries.Palette = palette
|
Related Examples
Windows forms: Chart Gallery\Area\Standard Area
Windows forms: Chart Gallery\Area\Sampled 2D Area
Windows forms: Chart Gallery\Area\Sampled 3D Area
See Also